
Learn AI From Scratch presents a draft curriculum covering foundational topics for building an understanding of artificial intelligence.
Data Visualization Guide
The Data Visualisation Guide covers design principles, storytelling, chart types, accessibility, and other visualization topics.
About Data Visualization Guide
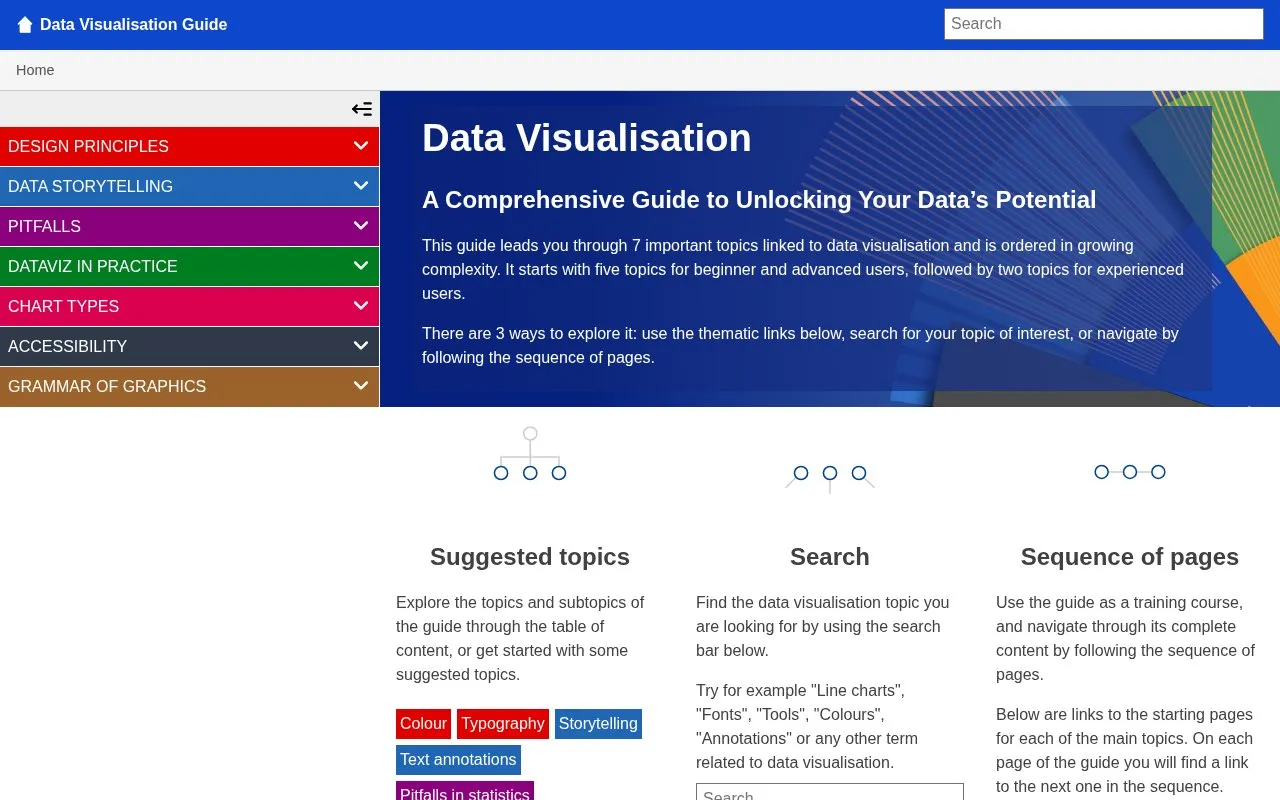
The Data Visualization Guide is a web-based educational resource focused on core data visualization concepts and practices. It covers 7 key topics including design principles, data storytelling, common pitfalls, chart types, accessibility, and the Grammar of Graphics, organized in order of growing complexity to suit beginner, advanced, and experienced users. Users can explore the guide via thematic topic browsing, a built-in search function, or by following a sequential page order designed for structured, course-like learning. No pricing information is listed for the resource.
Key features
- Covers 7 core data visualization topics across skill levels
- Offers thematic browsing of all guide topics and subtopics
- Includes built-in search for specific data visualization terms
- Provides sequential page navigation for structured learning
- Covers design principles, storytelling, chart types, and accessibility
- Includes advanced content on the Grammar of Graphics
Best for: Individuals seeking to learn or improve data visualization skills across beginner to advanced levels.
Good for
- Organized by growing complexity to suit different skill levels
- Offers three distinct navigation methods for different learning preferences
- Covers a broad range of core data visualization topics
Data Visualization Guide at a glance
- Category
- Education & Learning › Learn to Code
- Type
- Website
- Pricing
- Not confirmed. Check the site
- Platforms
- Web
- Open source
- Not stated
- Language
- English
- Last checked
- Oct 6, 2026 · Online when checked
- Listed
- Oct 5, 2026
Data Visualization Guide alternatives
Tools and sites you could use instead, ranked by how closely they match.

Scrimba offers interactive coding courses and tutorials covering frameworks, web development, JavaScript, HTML, and CSS.

Codeguage offers short self-study courses focused on core programming topics.

design.tips provides design tools, introductory lessons, and practical guidance.
A curated list collects free IT, computer science, design, and business courses that include certificates.

Gymnasium offers free online courses and tutorials in design, with material for people developing design careers.
Popular in Learn to Code
Well-known listings from the same topic.
Codelabscodelabs.developers.google.comScratchscratch.mit.eduTelegram Bot APIcore.telegram.org/botsStudent Developer Packeducation.github.com/packHacksplaininghacksplaining.comQB64SourceCodeqb64tutorial.com


Data Visualization Guide FAQ
What topics are covered in the Data Visualization Guide?
The guide covers 7 key topics including design principles, data storytelling, common pitfalls, chart types, accessibility, and the Grammar of Graphics.
How can users navigate the guide?
Users can navigate via thematic topic browsing, a built-in search function, or sequential page order.
Is the guide suitable for different skill levels?
Yes, content is organized by growing complexity for beginner, advanced, and experienced users.
Is something wrong or out of date?
Tell us and an editor will check it.
Own this website?
Claim this listing
Claim the listing and suggest updates yourself. An editor checks every claim first.