
An open-source JavaScript visualization library that streamlines the creation of beautiful and accessible SVG data visualizations.
Datamaps
A jQuery plugin for geographical map data visualizations using d3.js, SVG.
About Datamaps
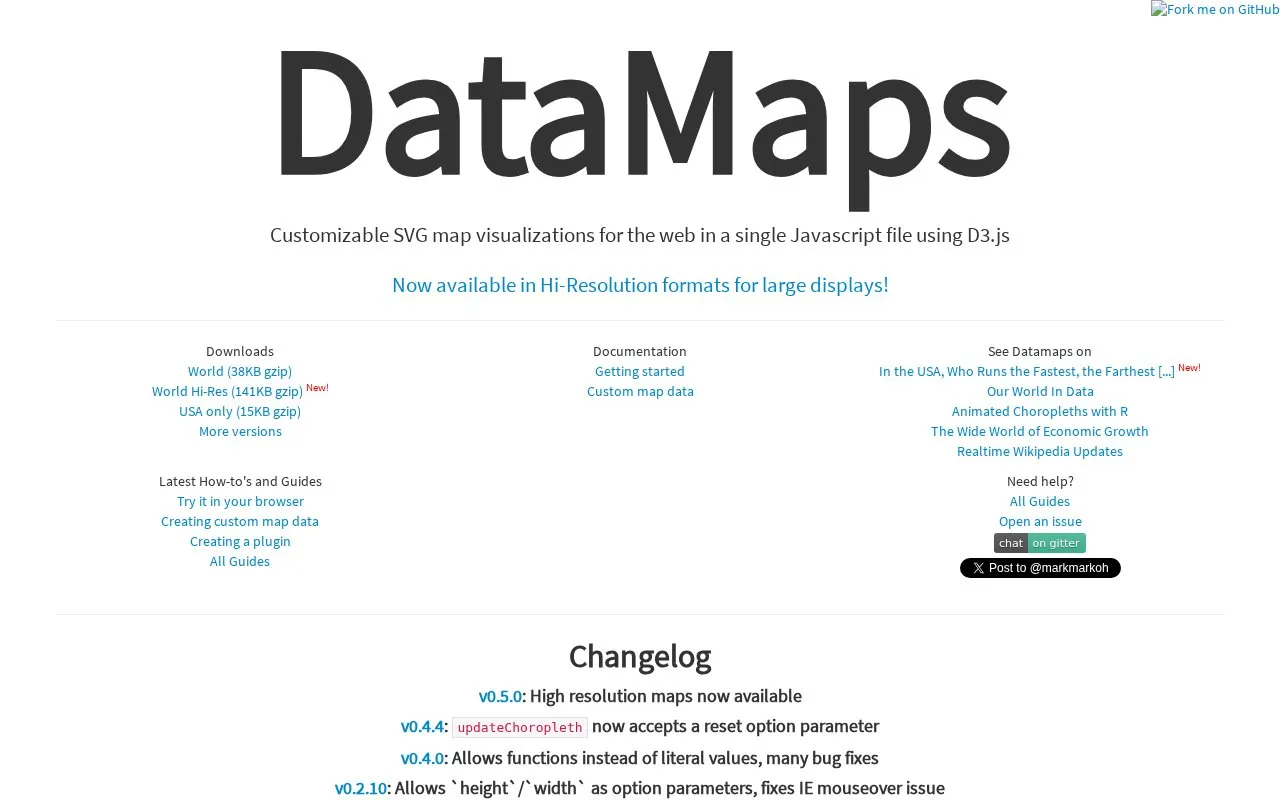
Datamaps is a single JavaScript file for creating customizable SVG map visualizations for the web. It is described as a jQuery plugin that uses D3.js. The project is by Mark DiMarco and is released under the MIT License.
The site provides downloads for World, World Hi-Res, and USA-only map files, along with documentation and guides. Visitors can view examples including basic maps, choropleths, state labels, bubbles, arcs, projections with graticules, and zoom. Configuration options cover scope, projection, size, fills, data fetching from JSON or CSV, geography popups, bubbles, and arcs. Guides explain getting started, creating custom map data, and creating a plugin.
Datamaps suits web developers who need to add geographic data visualizations to websites using JavaScript, SVG, and D3.js. It also lists changelog entries and links for help, including guides and issue reporting.
Key features
- Single JavaScript file for SVG map visualizations
- World, Hi-Res, and USA-only map downloads
- Choropleth maps with custom fill color data
- Bubble, arc, and graticule plugins
- Custom projection, zoom, and popup configuration
- Guides for custom map data and plugins
Best for: Web developers adding SVG geographic maps with D3.js to websites.
Good for
- Single file focused on web map visualizations
- Multiple map scopes including Hi-Res option
- Examples and configuration documentation included
- Released under the MIT License
Watch out for
- Default scopes limited to USA and world
- State labels plugin works with USA map only
Datamaps at a glance
- Website
- datamaps.github.io
- Category
- AI & Machine Learning › AI Data & Analytics
- Type
- Website
- Pricing
- Not confirmed. Check the site
- Platforms
- Web
- Open source
- Not stated
- Last checked
- Oct 5, 2026 · Online when checked
- Listed
- Oct 5, 2026
Datamaps alternatives
Tools and sites you could use instead, ranked by how closely they match.

Design Arena benchmarks design through crowdsourced challenges, votes, and winner selection.

Python package which helps to debug machine learning classifiers and explain their predictions.
Open source
24 alternatives
Orange Data Mining provides open-source machine learning and data visualization tools.

This data science agent helps clean datasets, create visualizations and models, and generate reports.
Popular in AI Data & Analytics
Well-known listings from the same topic.
Dotgetdot.aiForvioforvio.comFluidAI Medicalfluidai.mdApache Zeppelinzeppelin.apache.orgSola Securitysola.securityQuadraticquadratichq.com


Datamaps FAQ
What is Datamaps?
Datamaps is a JavaScript file for customizable SVG map visualizations for the web using D3.js, described as a jQuery plugin.
What map versions are available for download?
The site lists World, World Hi-Res, and USA-only versions, plus a link to more versions.
What examples does Datamaps show?
Examples include basic maps, choropleths, state labels, bubbles, arcs, projections with graticules, and zoom.
How can I learn to use Datamaps?
The site provides documentation and guides on getting started, creating custom map data, and creating a plugin.
Is something wrong or out of date?
Tell us and an editor will check it.
Own this website?
Claim this listing
Claim the listing and suggest updates yourself. An editor checks every claim first.