
This episode visualizer graphs ratings and watch time across television series and seasons.
Series Graph
Series Graph plots television episode ratings so viewers can explore changes across a show.
About Series Graph
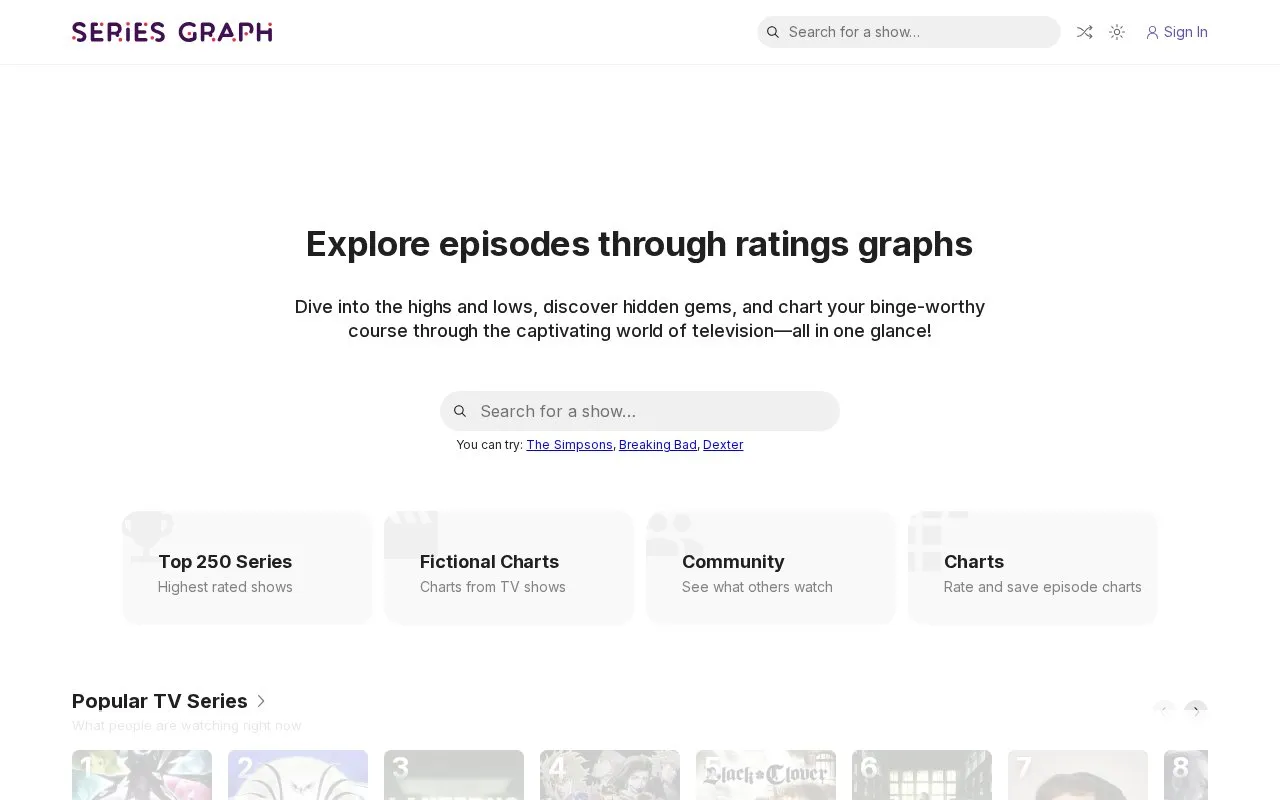
Series Graph is a website for exploring television episode ratings across a show. It presents episode scores as graphs for comparison and brings together community-made charts, show lists and rankings.
Pricing is not clearly stated.
Key features
- Rate and save episode charts
- Browse the Top 250 Series and popular TV Series
- Explore popular custom charts from the community
- View fan-made fictional shows with full episode ratings, names and storylines
- Browse community show lists and tier lists
- Browse franchise pages for TV universes and series with multiple shows
- The site presents a Series Graph Plus option with unlimited charts, no ads, a custom profile and advanced stats
Best for: Viewers who want to explore episode-level ratings and see what other people are watching.
Series Graph at a glance
- Website
- seriesgraph.com
- Type
- Online tool
- Pricing
- Not confirmed. Check the site
- Platforms
- Web
- Details verified
- Oct 22, 2026 · Official source
- Open source
- Not stated
- Language
- English
- Last checked
- Oct 5, 2026 · Online when checked
- Listed
- Oct 5, 2026
Series Graph alternatives
Tools and sites you could use instead, ranked by how closely they match.

Episode ratings for a television show are presented as a graph on the TV Chart site.

TV Charts graphs IMDb ratings across episodes of current and past television series.

Episode Hive helps viewers track shows, discover highly rated episodes, and find where to stream them.
Free
10 alternatives
Rating Graph visualizes ratings and trends for TV shows and films using data from user ratings.
Taste recommends movies and television using ratings and preferences from like-minded viewers.
Popular in Movie & TV Databases
Well-known listings from the same topic.
Common Sense Mediacommonsensemedia.orgRotten Tomatoesrottentomatoes.comWatchOrbitwatchorbit.meWhenToStreamwhentostream.comMovie Countdownmoviescountdown.comWeTrakrwetrakr.com


Is something wrong or out of date?
Tell us and an editor will check it.
Own this website?
Claim this listing
Claim the listing and suggest updates yourself. An editor checks every claim first.