
AInvest provides stock analysis, market news, and predictive tools for people following trades and investment portfolios.
techanjs
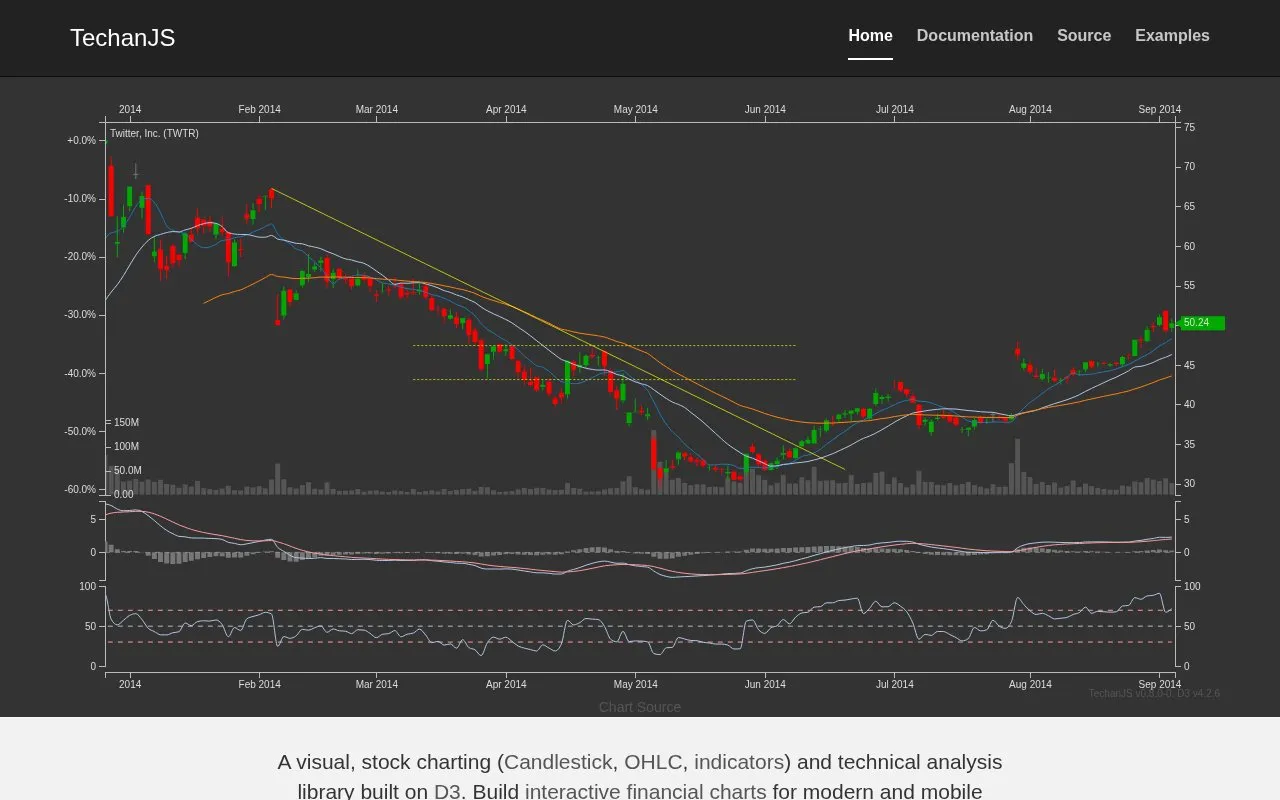
A visual, stock charting (Candlestick, OHLC, indicators) and technical analysis library built on D3.
About techanjs
TechanJS is a stock charting and technical analysis library built on D3. It is for building interactive financial charts for modern and mobile browsers.
It supports candlestick and OHLC charts, volume display, and indicators including moving averages, Ichimoku Cloud, RSI, and MACD.
Key features
- Candlestick chart rendering
- OHLC chart rendering
- Volume display
- Simple and exponential moving averages
- Ichimoku Cloud indicator
- RSI and MACD indicators
Best for: Developers adding interactive stock charts and technical indicators to websites.
Good for
- Built on D3 for web-based financial charts
- Supports interactive charts for modern and mobile browsers
- Provides candlestick, OHLC, volume, and several technical indicators
techanjs at a glance
- Website
- techanjs.org
- Category
- AI & Machine Learning › AI Data & Analytics
- Type
- Website
- Pricing
- Not confirmed. Check the site
- Platforms
- Web
- Open source
- Not stated
- Language
- English
- Last checked
- Oct 5, 2026 · Online when checked
- Listed
- Oct 5, 2026
techanjs alternatives
Tools and sites you could use instead, ranked by how closely they match.

Built for designers, journalist and non-technical people can tell their stories.
Popular in AI Data & Analytics
Well-known listings from the same topic.
Dotgetdot.aiForvioforvio.comFluidAI Medicalfluidai.mdApache Zeppelinzeppelin.apache.orgSola Securitysola.securityQuadraticquadratichq.com


Is something wrong or out of date?
Tell us and an editor will check it.
Own this website?
Claim this listing
Claim the listing and suggest updates yourself. An editor checks every claim first.