

The Netherlands Institute for Sound and Vision is an audiovisual archive and museum with collections about radio and television history.
Vision Zero Report Card
The 2026 Vision Zero Report Card tracks truck fatalities across 19 U.S. cities and compares progress among Vision Zero adopters.
About Vision Zero Report Card
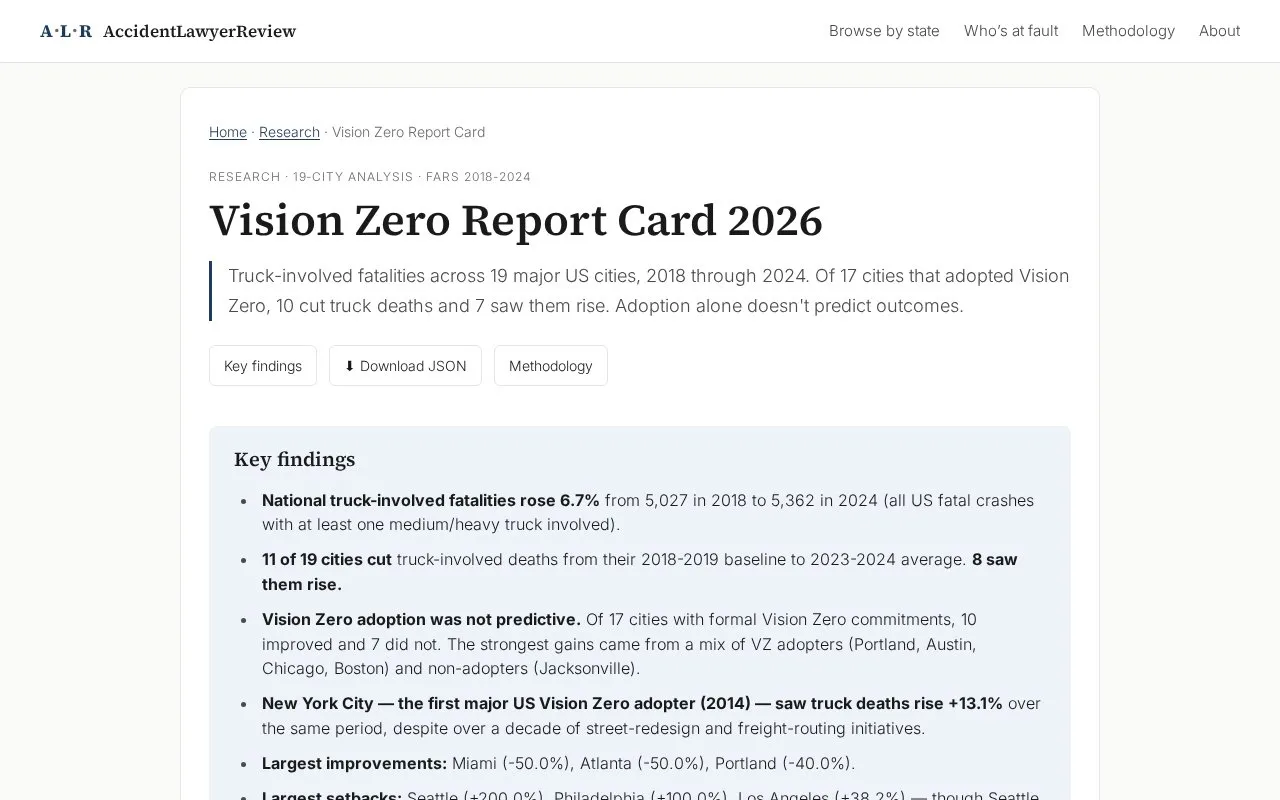
This research page tracks truck-involved traffic fatalities in 19 major U.S. cities. It compares average annual deaths in 2018-2019 with the 2023-2024 average, and it groups the cities by whether they have formal Vision Zero commitments. Nationally, truck-involved fatalities rose 6.7%, from 5,027 in 2018 to 5,362 in 2024. Eleven of the 19 cities reduced these deaths over the period, and eight saw increases. Of the 17 cities with formal Vision Zero commitments, 10 improved and 7 did not. The page states that Vision Zero adoption was not predictive of outcomes.
The figures come from NHTSA's Fatality Analysis Reporting System (FARS), a federal census of U.S. fatal traffic crashes. "Truck-involved" means medium or heavy commercial trucks (FARS body-type codes 60-69). Passenger pickups under 10,000 lbs gross weight are excluded. The page notes several limits: annual counts are small in some cities, so percentage changes can swing widely; city boundaries may cause highway crashes at city limits to be attributed to surrounding counties; and the 2024 data is preliminary.
Key features
- Compares average annual truck-involved fatalities for 2018-2019 and 2023-2024 across 19 cities
- Ranks cities by percentage change and by recent fatalities per 100,000 residents
- Shows raw yearly truck-involved fatality counts for each city from 2018 to 2024
- Groups results by whether each city has a formal Vision Zero commitment
- Flags cities with small annual counts whose percentage changes may be unreliable
- Builds figures from NHTSA FARS national downloads, with methodology described on the page
Best for: Readers who want city-level trends in truck-involved traffic deaths across selected large U.S. cities and how those trends compare with Vision Zero adoption.
Good for
- Uses FARS, which the page describes as a complete federal census of U.S. fatal traffic crashes
- Publishes baseline averages, recent averages, and yearly counts, so the figures can be checked
- States its caveats about small counts, city boundaries, and preliminary 2024 data
Watch out for
- Covers only 19 U.S. cities, not all cities or the whole country
- Percentage changes in cities with small annual counts can be noisy, as the page states
- The 2024 figures are preliminary and may be revised in the Final File expected in 2027
Vision Zero Report Card at a glance
- Category
- Research & Data › Open Data & Datasets
- Type
- Website
- Pricing
- Not confirmed. Check the site
- Platforms
- Web
- Open source
- Not stated
- Language
- English
- Last checked
- Oct 6, 2026 · Online when checked
- Listed
- Oct 5, 2026
Vision Zero Report Card alternatives
Tools and sites you could use instead, ranked by how closely they match.

Uddevalla's open data page links to Kolada indicators for comparing municipal services and resource use.

The IUCN Red List tracks threatened species and publishes assessment information, including species groups and extinction-risk figures.

This open data portal covers Grand Paris Seine Ouest and its eight member cities, including Meudon and Boulogne-Billancourt.

ARS tracks antibiotic resistance across Germany through a national surveillance network coordinated by the Robert Koch Institute.
WOVOdat catalogs volcano unrest records and provides tools for searching and comparing activity over time.
Popular in Open Data & Datasets
Well-known listings from the same topic.
data.worlddata.worldNASA APIapi.nasa.govState of Hawaiidata.hawaii.govCosmoSimcosmosim.orgdata.meudon.frdata.meudon.frESS-DIVEess-dive.lbl.gov


Vision Zero Report Card FAQ
What data source is used?
The figures come from NHTSA's Fatality Analysis Reporting System (FARS) National CSV downloads for 2018 through 2024, joining the accident and vehicle tables.
What counts as a truck in this report?
"Truck-involved" means crashes with at least one medium or heavy commercial truck (FARS body-type codes 60-69). Passenger pickup trucks under 10,000 lbs gross weight are excluded.
Is the 2024 data final?
No. The page says FARS 2024 is preliminary, and the Final File released in 2027 may revise it slightly.
Is something wrong or out of date?
Tell us and an editor will check it.
Own this website?
Claim this listing
Claim the listing and suggest updates yourself. An editor checks every claim first.