
This interactive visualization explores Bureau of Labor Statistics Occupational Outlook Handbook data, including employment, pay, and education information.
US Job Market Visualizer
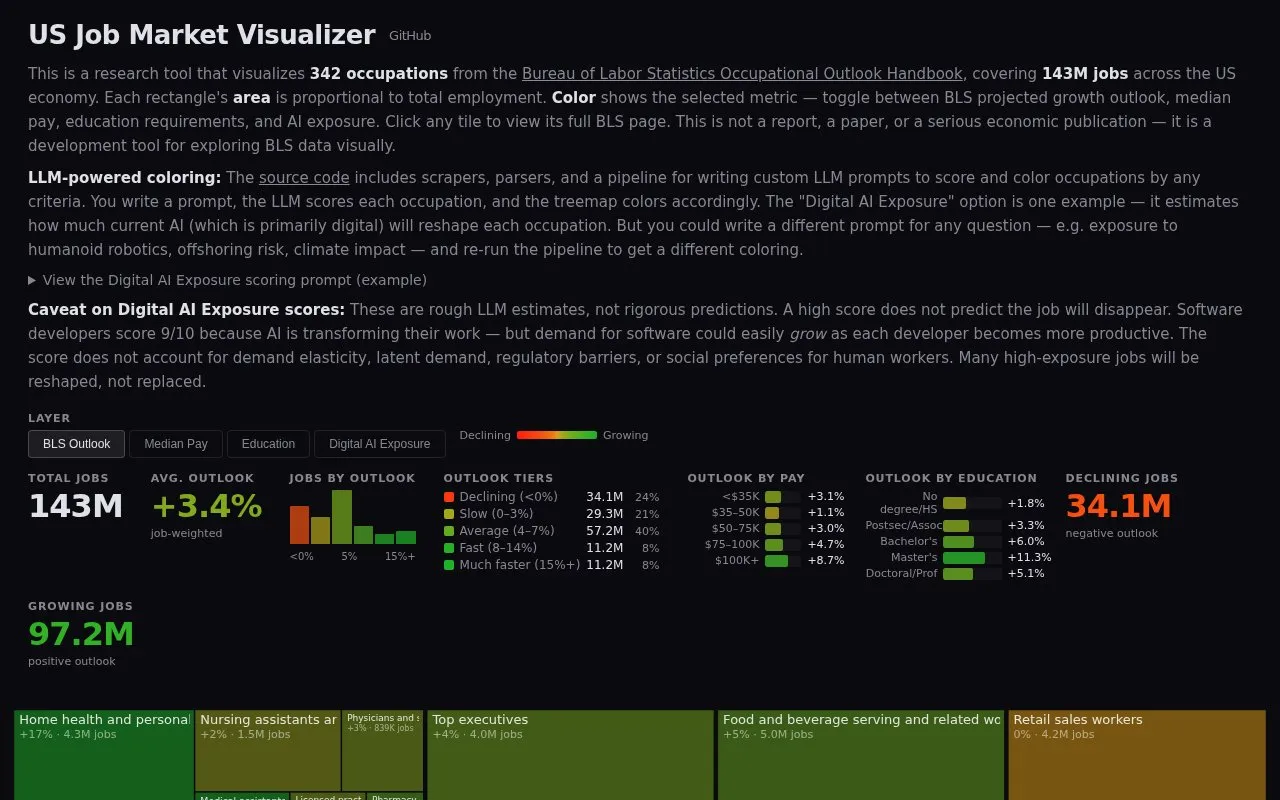
The US Job Market Visualizer charts 342 occupations and 143 million US jobs, with metrics for projected growth, pay, education, and AI exposure.
About US Job Market Visualizer
The US Job Market Visualizer is a research tool that displays 342 occupations from the Bureau of Labor Statistics Occupational Outlook Handbook, covering 143 million jobs across the US economy. Each occupation appears as a rectangle sized in proportion to its total employment. The color of each rectangle shows a selected metric: BLS projected growth outlook, median pay, education requirements, or AI exposure. Clicking a tile opens its full BLS page.
The site is a development tool for exploring BLS data visually. It is not a report, a paper, or a serious economic publication. The AI exposure metric comes from an example prompt that asks a large language model to rate each occupation from 0 to 10. The site describes these scores as rough estimates, not rigorous predictions, and notes that a high score does not mean a job will disappear.
Key features
- Treemap where rectangle area reflects each occupation's total employment
- Color toggle for BLS projected growth, median pay, education, or AI exposure
- Click any tile to open its BLS Occupational Outlook Handbook page
- Example AI exposure prompt that scores occupations on a 0 to 10 scale
- Pipeline for writing custom LLM prompts to score and recolor occupations
Best for: People who want to explore US Bureau of Labor Statistics occupational data visually, such as those comparing growth, pay, and education levels across occupations.
Good for
- Draws on Bureau of Labor Statistics Occupational Outlook Handbook data for 342 occupations
- Tile size shows the relative employment of each occupation at a glance
- Custom prompts allow coloring by criteria other than the built-in AI exposure example
Watch out for
- The site states it is not a report, a paper, or a serious economic publication
- AI exposure scores are rough LLM estimates and not rigorous predictions
- The scores do not account for demand elasticity, latent demand, regulatory barriers, or social preferences for human workers
US Job Market Visualizer at a glance
- Website
- karpathy.ai/jobs
- Category
- Business & Careers › Job Boards & Careers
- Type
- Website
- Pricing
- Not confirmed. Check the site
- Platforms
- Web
- Open source
- Not stated
- Language
- English
- Last checked
- Oct 6, 2026 · Online when checked
- Listed
- Oct 5, 2026
US Job Market Visualizer alternatives
Tools and sites you could use instead, ranked by how closely they match.

This Codeberg repository contains the official source project for KYCnot.me.

Pimp My Money lists digital marketing courses and group buys, with categories including business growth.

Compare cryptocurrency market and privacy-market capitalization figures through charts and data on this coin-tracking site.

Live Coin Watch tracks cryptocurrency prices, portfolios, historical charts, exchange markets, trading volume, liquidity, and order books.

We Work Remotely lists remote jobs and provides search filters across fields such as programming, marketing, and customer service.
Popular in Job Boards & Careers
Well-known listings from the same topic.
AWS re/Startaws.amazon.com/training/restartData.gov Resourcesresources.data.govLevels.fyilevels.fyiNarrow AIgetnarrow.aiHimalayashimalayas.appRX Resumerxresu.me


US Job Market Visualizer FAQ
Is this an official economic report?
No. The site describes itself as a development tool for exploring BLS data visually and states that it is not a report, a paper, or a serious economic publication.
How are the AI exposure scores produced?
An LLM rates each occupation from 0 to 10 using a written prompt. The site describes these as rough estimates and says a high score does not predict that the job will disappear.
Can the tiles be colored by a different measure?
The site says its pipeline lets you write a custom LLM prompt to score occupations by other criteria, such as offshoring risk or climate impact, and re-run the pipeline to recolor the treemap.
Is something wrong or out of date?
Tell us and an editor will check it.
Own this website?
Claim this listing
Claim the listing and suggest updates yourself. An editor checks every claim first.