
Grafana
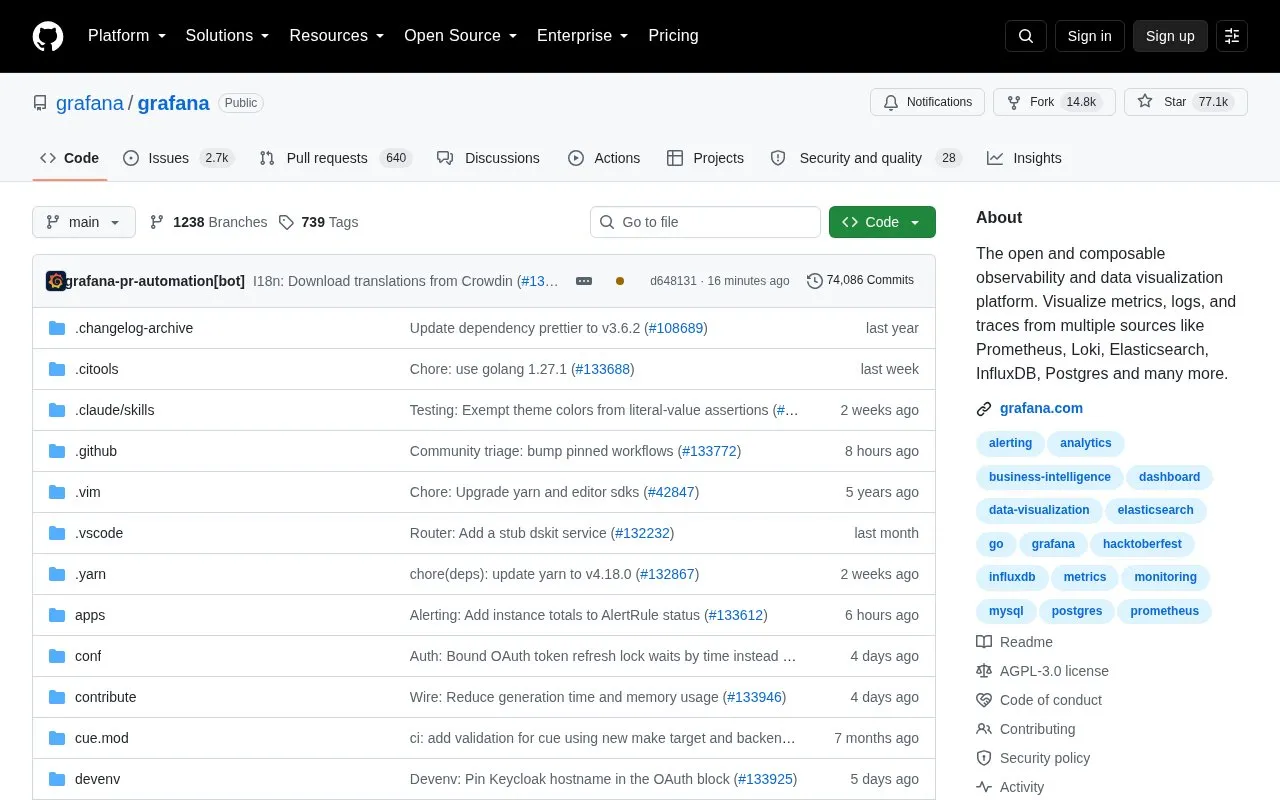
Visualize metrics, logs, and traces from multiple sources with Grafana, an observability and data visualization platform.
About Grafana
Grafana is an open and composable observability and data visualization platform. It visualizes metrics, logs, and traces from multiple sources like Prometheus, Loki, Elasticsearch, InfluxDB, Postgres and many more. Its repository lists an AGPL-3.0 license.
Pricing is not clearly stated.
Grafana at a glance
- Website
- github.com/grafana/grafana
- Category
- Development › Developer Tools
- Type
- Open-source project
- Pricing
- Not confirmed. Check the site
- Details verified
- Oct 22, 2026 · Official source
- Open source
- Yes · Source code
- Language
- English
- Last checked
- Oct 5, 2026 · Online when checked
- Listed
- Oct 5, 2026
Guides for Developer Tools
Grafana alternatives
Tools and sites you could use instead, ranked by how closely they match.

Grafana Cloud unifies metrics, logs, and traces for full-stack observability and AI workloads.
Free
24 alternatives
Python developers can use Dash to build data apps and dashboards without requiring JavaScript.
Open source
24 alternatives
Browse large JSONL, Parquet, and CSV datasets in VS Code with the Bread Dataset Viewer extension.
Open source
24 alternatives
Interactive scientific visualization in Python is supported by VisPy, a library that uses OpenGL for rendering.

PipeRider provided code review tools for dbt data and has been superseded by Recce.
Open source
24 alternatives
Explore command-line utilities and other tools for Go projects in this repository collection.
Open source
24 alternativesPopular in Developer Tools
Well-known listings from the same topic.
AppDevToolsappdevtools.comCommand Not Foundcommand-not-found.comTestFlighttestflight.apple.com/join/A8GwCnq8Sourcegraphabout.sourcegraph.comProject Wallaceprojectwallace.comCarbon Calculatorwebsitecarbon.com


Is something wrong or out of date?
Tell us and an editor will check it.
Own this website?
Claim this listing
Claim the listing and suggest updates yourself. An editor checks every claim first.