

vispy
Interactive scientific visualization in Python is supported by VisPy, a library that uses OpenGL for rendering.
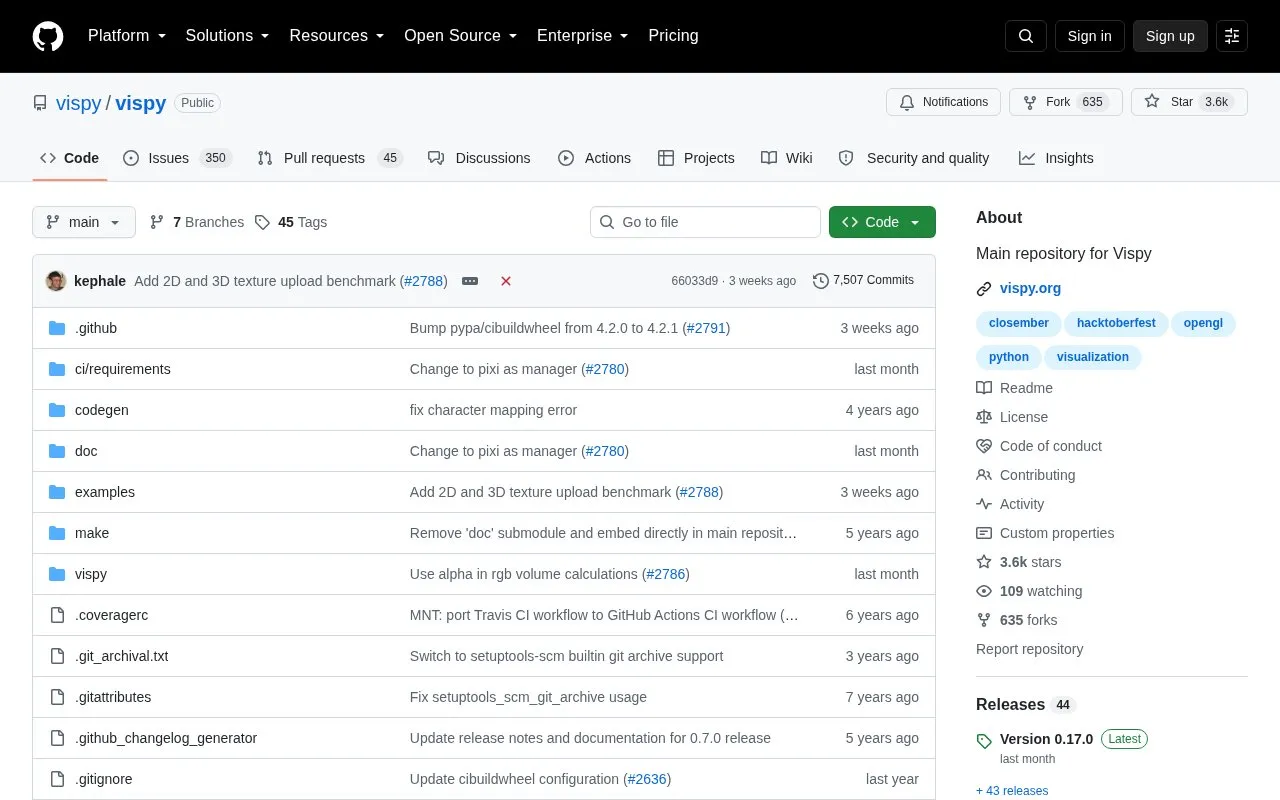
About vispy
VisPy is a Python library for interactive scientific visualization in 2D and 3D. It uses OpenGL and the processing power of graphics processing units (GPUs) to display large datasets. The main repository is hosted on GitHub, with documentation and installation instructions on the VisPy website.
You can use it to create interactive scientific plots, visualize real-time data, and view 3D models such as meshes and volume renderings. It includes an interface called gloo for OpenGL ES 2.0 that works with NumPy, an app module for working with window backends such as Qt, wx, glfw, and Jupyter Notebook, and experimental modules for scene graphs and high-level plotting, including a backend for matplotlib.
It suits Python developers who know OpenGL or want to learn it, as well as scientists looking for a plotting toolkit for large datasets. The app and gloo interfaces are relatively stable, while the scene and plot interfaces are still experimental and subject to change.
Key features
- Interactive 2D/3D data visualization in Python with OpenGL
- Uses GPU processing to display large datasets
- Supports interactive plots and real-time data visualization
- Visualizes 3D meshes and volume rendering
- Provides gloo interface for OpenGL ES 2.0 with NumPy
- Works with Qt, wx, glfw, and Jupyter Notebook backends
Best for: Python developers and scientists who need interactive 2D/3D visualization of large or real-time datasets.
Good for
- Handles large datasets through GPU-based OpenGL rendering
- Supports both low-level OpenGL access and high-level plotting
- Works across multiple window and notebook backends
Watch out for
- High-level plotting and scene interfaces are experimental
- Public APIs are subject to change during development
vispy at a glance
- Website
- github.com/vispy/vispy
- Category
- Development › Developer Tools
- Type
- Open-source project
- Pricing
- Not confirmed. Check the site
- Open source
- Not stated
- Language
- English
- Last checked
- Oct 5, 2026 · Online when checked
- Listed
- Oct 5, 2026
Guides for Developer Tools

vispy alternatives
Tools and sites you could use instead, ranked by how closely they match.

Visualize metrics, logs, and traces from multiple sources with Grafana, an observability and data visualization platform.
Open source
24 alternatives
Python developers can use Dash to build data apps and dashboards without requiring JavaScript.
Open source
24 alternatives
Exploratory data analysis in Python is the focus of Dora, a library with functions for cleaning, feature selection, visualization, and validation.
Open source
24 alternatives
Jupyter Notebook combines live code, equations, explanatory text, visualizations, and interactive computing in a web platform.

PipeRider provided code review tools for dbt data and has been superseded by Recce.
Open source
24 alternatives
Browse large JSONL, Parquet, and CSV datasets in VS Code with the Bread Dataset Viewer extension.
Open source
24 alternativesPopular in Developer Tools
Well-known listings from the same topic.
AppDevToolsappdevtools.comCommand Not Foundcommand-not-found.comTestFlighttestflight.apple.com/join/A8GwCnq8Sourcegraphabout.sourcegraph.comProject Wallaceprojectwallace.comCarbon Calculatorwebsitecarbon.com


vispy FAQ
What is VisPy?
VisPy is a Python library for interactive 2D/3D scientific visualization that renders with OpenGL using GPU processing.
Who is VisPy for?
It is for Python users who know OpenGL and for scientists seeking a high-level plotting toolkit for large datasets.
What can you do with VisPy?
You can create interactive plots, visualize real-time data, and view 3D meshes and volume renderings, including in Qt or Jupyter Notebook widgets.
How do you install VisPy?
Installation instructions are provided on the VisPy website linked from the repository.
Is something wrong or out of date?
Tell us and an editor will check it.
Own this website?
Claim this listing
Claim the listing and suggest updates yourself. An editor checks every claim first.