

Chartdb
Create and edit database diagrams with ChartDB, which can visualize schemas from a database query.
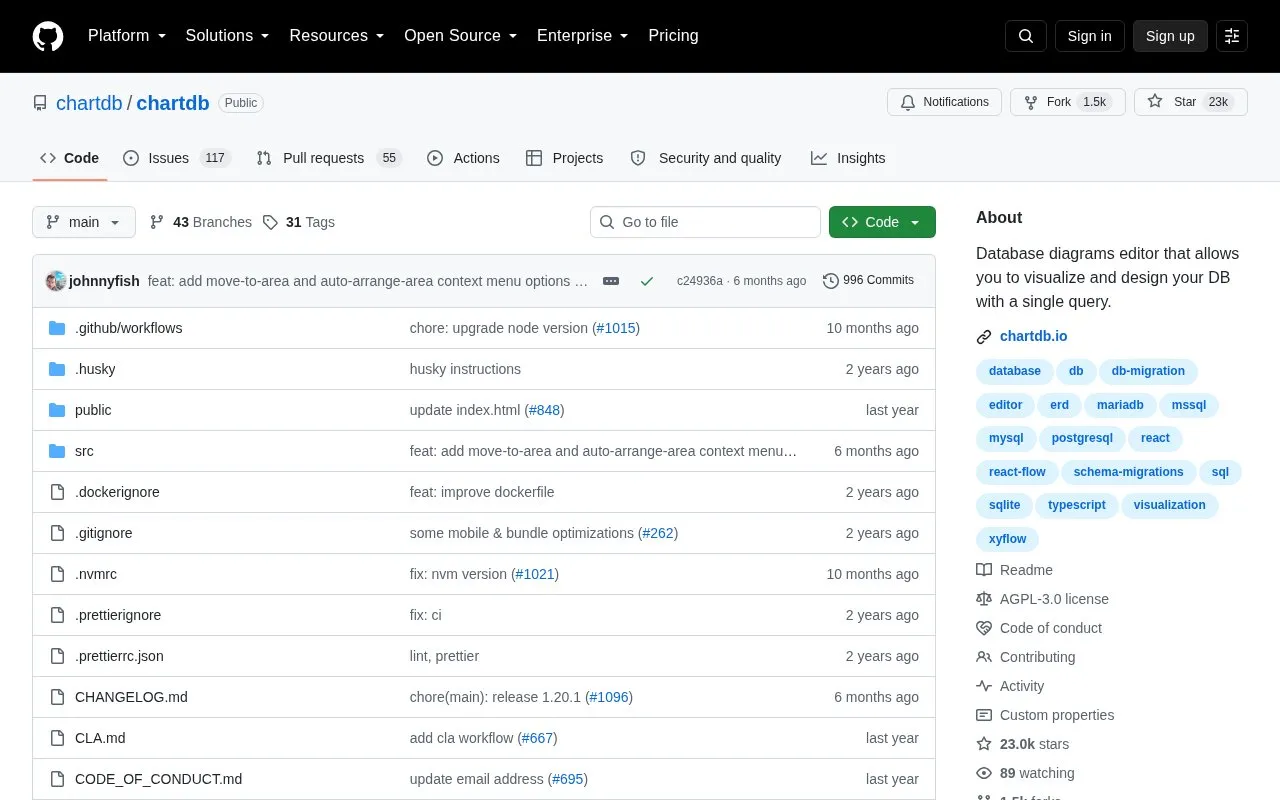
About Chartdb
ChartDB is an open-source, web-based editor for creating and editing database diagrams. Users run a provided query in their database and paste the resulting JSON into ChartDB to display the schema as a diagram, which can be edited and annotated. It can generate DDL scripts in a different database dialect for migration, and works without an account and without providing a database password.
It supports PostgreSQL, MySQL, SQL Server, MariaDB, SQLite including Cloudflare D1, CockroachDB and ClickHouse. It is in public beta and can be used as a hosted version or deployed locally with npm or Docker; AI-based export requires an OpenAI API key or a custom inference endpoint.
Key features
- Visualize database schema from single query JSON output
- Edit and annotate tables and relationships in diagram editor
- Generate DDL scripts in different database dialect for migration
- Supports PostgreSQL, MySQL, SQL Server, MariaDB, SQLite, CockroachDB, ClickHouse
- Use cloud version or self-host with Docker or npm
- Works without account and without providing database password
Best for: Developers and teams who need to document, understand, or migrate existing database schemas.
Good for
- Open source with no account required to use features
- Imports schema without requiring database password
- Can be self-hosted locally with npm or Docker
Watch out for
- In public beta
- AI export only works after configuring OpenAI key or custom model endpoint
- Includes Fathom Analytics unless disabled via build or run option
Chartdb at a glance
- Website
- github.com/chartdb/chartdb
- Category
- Development › Developer Tools
- Type
- Open-source project
- Pricing
- Not confirmed. Check the site
- Open source
- Yes · Source code
- Language
- English
- Last checked
- Oct 5, 2026 · Online when checked
- Listed
- Oct 5, 2026
Guides for Developer Tools


Chartdb alternatives
Tools and sites you could use instead, ranked by how closely they match.

ToDiagram turns JSON, YAML, XML, CSV, and Mermaid into interactive diagrams and supports building custom node diagrams.

Regular expressions can be tested and shared in iHateRegex, a playground with diagrams and notes.

Code snippets, notes, API requests, diagrams, and calculations can be organized in massCode.

Polars provides a Rust query engine for DataFrames, with a Python interface for data work.
Open source
24 alternatives
Visualize metrics, logs, and traces from multiple sources with Grafana, an observability and data visualization platform.
Open source
24 alternatives
For Python data preparation, DataPrep offers an open-source low-code library to collect, clean, and visualize data.
Open source
24 alternativesPopular in Developer Tools
Well-known listings from the same topic.
AppDevToolsappdevtools.comCommand Not Foundcommand-not-found.comTestFlighttestflight.apple.com/join/A8GwCnq8Sourcegraphabout.sourcegraph.comProject Wallaceprojectwallace.comCarbon Calculatorwebsitecarbon.com


Chartdb FAQ
How do I import my schema into ChartDB?
Choose your database in the app, run the provided query in your database, then copy and paste the resulting JSON into ChartDB.
Which databases are supported?
PostgreSQL, MySQL, SQL Server, MariaDB, SQLite including Cloudflare D1, CockroachDB, and ClickHouse.
What is needed for AI capabilities to work?
Configure either an OpenAI API key or a custom endpoint and model name, but not both.
Is something wrong or out of date?
Tell us and an editor will check it.
Own this website?
Claim this listing
Claim the listing and suggest updates yourself. An editor checks every claim first.