

Redash connects to data sources so users can query, visualize, and share company data.
MinusX
MinusX organizes company data and uses agents in an agentic business intelligence platform.
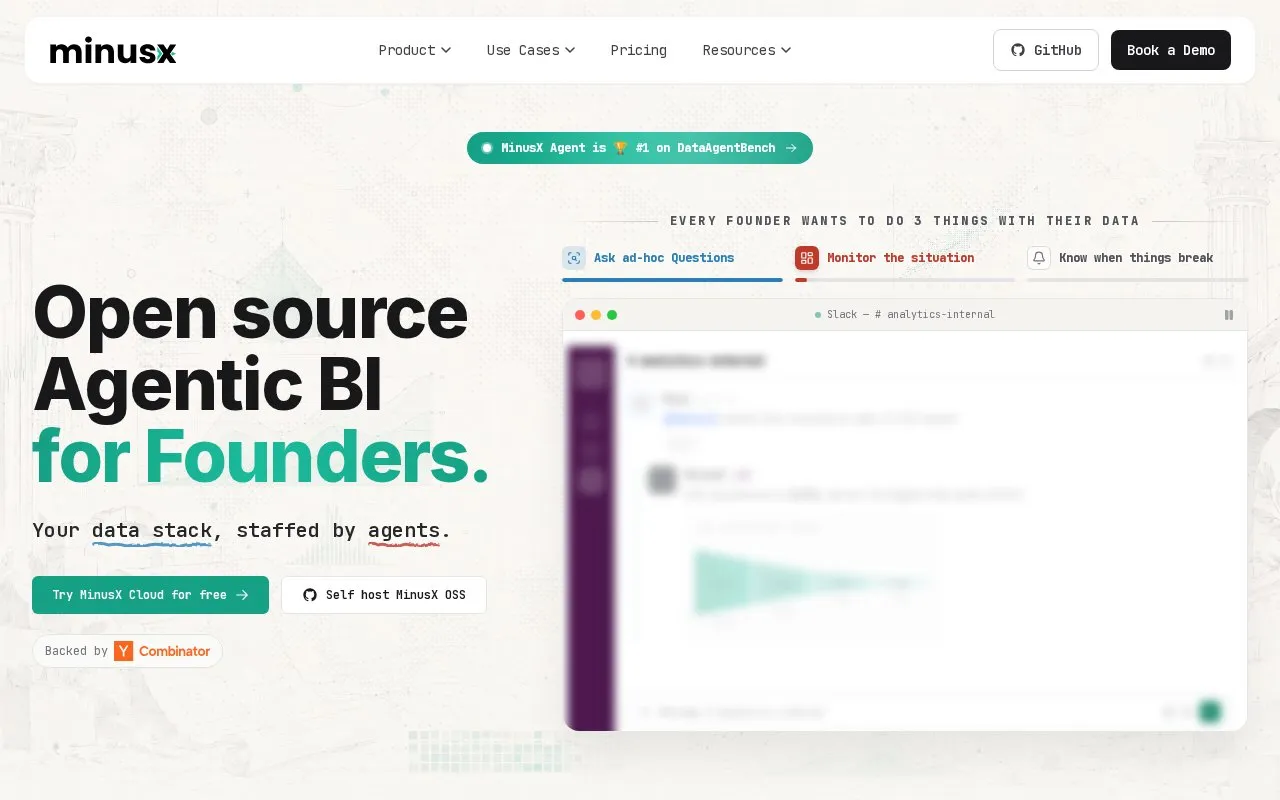
About MinusX
MinusX is an agentic business intelligence platform that organizes company data and uses agents to answer ad-hoc questions, monitor metrics, and notify when thresholds are crossed. It connects to databases and warehouses such as Postgres and BigQuery, and also accepts CSV uploads and Google Sheets for analysis. It provides a SQL editor and point-and-click query builder, visualizations, dashboards, slides and scrollable data stories, plus scheduled reports, alerts, Slack access and an MCP server. It can be self-hosted or used as managed cloud, with an option to bring own LLM keys, and includes a shared knowledge base and evals to record definitions.
Key features
- Answer ad-hoc questions with agent-generated SQL analysis
- Build dashboards with maps, funnels, heatmaps and filters
- Turn analysis into slides and scrollable data stories
- Send scheduled reports, threshold alerts and nudges
- Ask questions from Slack and connect via MCP server
- Connect Postgres, BigQuery, CSVs, Google Sheets and more
Best for: Founders and small teams who need to query and monitor company data without dedicated analysts.
Good for
- Offers self-hosting where warehouse stays in own environment
- Supports bringing own LLM keys for cloud use
- Includes shared knowledge base and evals to check answer context
MinusX at a glance
- Website
- minusx.ai
- Category
- AI & Machine Learning › AI Data Visualization
- Type
- Online tool
- Pricing
- Not confirmed. Check the site
- Platforms
- Web
- Open source
- Not stated
- Language
- English
- Good for
- Founders
- Last checked
- Oct 5, 2026 · Online when checked
- Listed
- Oct 5, 2026
MinusX alternatives
Tools and sites you could use instead, ranked by how closely they match.

Anomaly analyzes large spreadsheets and business datasets to create verifiable reports and interactive dashboards.
Flowpoint runs website analytics on-premises and provides an AI agent and MCP server within an organization’s environment.

Coefficient connects spreadsheets to CRM, databases, and other data sources, then supports live analysis, dashboards, and automated updates.

ChartPixel analyzes spreadsheets and survey data with AI and produces interactive charts, reports, and dashboards.

DataLine lets users chat with data and generate tables, charts, and dashboards through AI-driven analysis and visualization.
Popular in AI Data Visualization
Well-known listings from the same topic.


MinusX FAQ
Where does my data stay?
You can run MinusX OSS in your own environment, or use MinusX Cloud as a managed runtime. The cloud version allows bringing your own LLM keys.
Is this just a text-to-SQL chatbot?
No. The source notes SQL is about 25% of analyst work, and lists additional outputs including dashboards, metrics, alerts, docs, slides, data stories, reports and evals.
How does it handle company-specific definitions?
It auto-learns context from interactions, stores metrics and docs in a shared knowledge base, and lets you test behavior with evals.
Is something wrong or out of date?
Tell us and an editor will check it.
Own this website?
Claim this listing
Claim the listing and suggest updates yourself. An editor checks every claim first.