

This Hugging Face Space lets users upload a CSV, ask questions, and receive AI-generated analysis, visualizations, and answers.
Data Stories
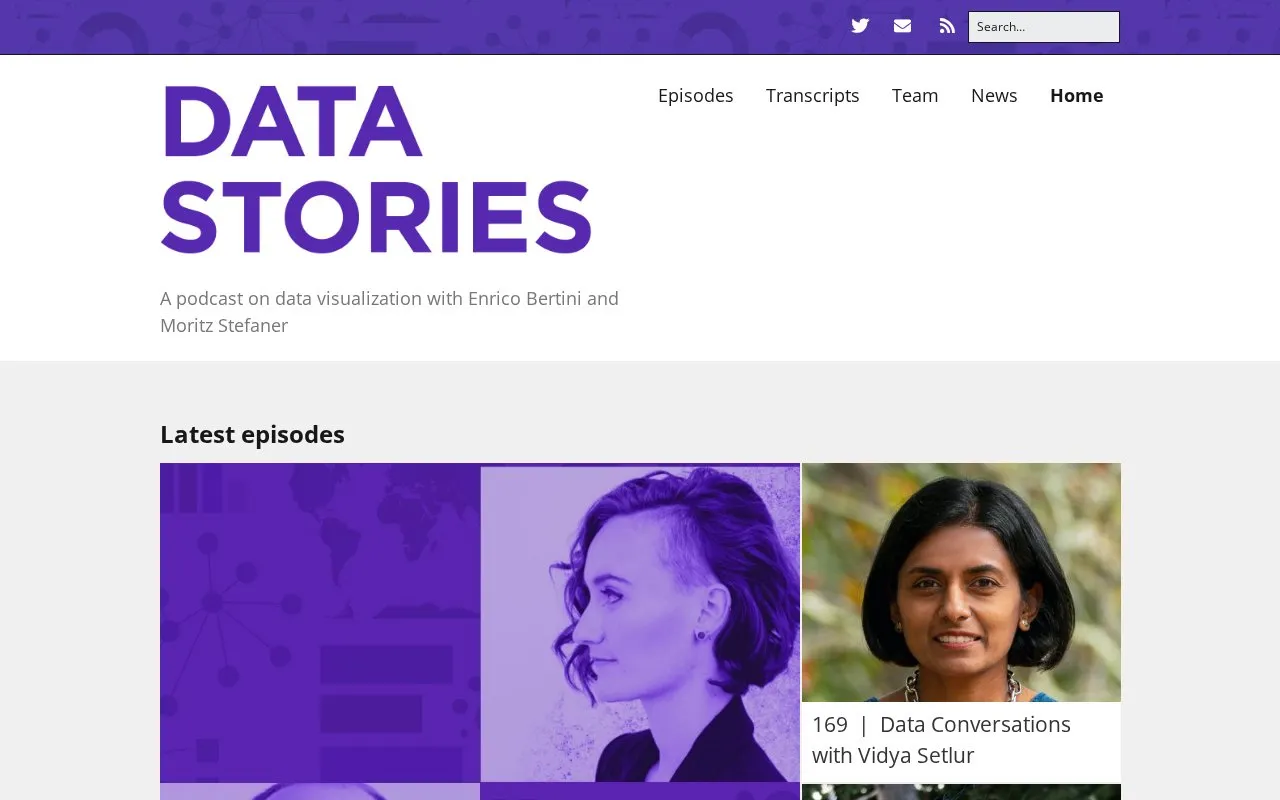
A podcast on data visualization with Enrico Bertini and Moritz Stefaner.
About Data Stories
Data Stories is a web-based podcast focused on data visualization, hosted by Enrico Bertini and Moritz Stefaner. It releases regular episodes covering topics including data storytelling, visualization design, and information visualization research, with a full archive of past episodes accessible to listeners.
The site provides a searchable archive of full written transcriptions for all 170 released episodes, and associated code and data for episodes are available on GitHub for technical users.
Key features
- Regular data visualization podcast episodes hosted by Enrico Bertini and Moritz Stefaner
- Full written transcriptions for all 170 released episodes
- Searchable archive for browsing and searching past episode content
- Episode-associated code and data available on GitHub
Best for: It is most useful for data visualization practitioners, researchers, and designers seeking discussions on data storytelling, visualization techniques, and related field developments.
Good for
- Large, diverse archive of 170 episodes covering a wide range of data visualization topics
- Full transcriptions of all episodes are available for easy reference and searching
- Associated episode code and data are publicly accessible on GitHub
Data Stories at a glance
- Website
- datastori.es
- Category
- AI & Machine Learning › AI Data Visualization
- Type
- Website
- Pricing
- Not confirmed. Check the site
- Platforms
- Web
- Open source
- Not stated
- Language
- English
- Last checked
- Oct 5, 2026 · Online when checked
- Listed
- Oct 5, 2026
Data Stories alternatives
Tools and sites you could use instead, ranked by how closely they match.

Bricks turns CSV and Excel data into dashboards and reports with AI assistance.

Zola Analytics turns plain-language questions into cited research answers, live charts and finished reports using data from multiple sources.
Free trial
17 alternatives
DataLine lets users chat with data and generate tables, charts, and dashboards through AI-driven analysis and visualization.

Backstory helps sales teams investigate pipeline questions and decide what to do next using AI revenue analysis.

RowSpeak analyzes spreadsheets, PDFs, and image tables with AI and creates charts, dashboards, and reports.
Popular in AI Data Visualization
Well-known listings from the same topic.
Anomaly AIfindanomaly.aiMinusXminusx.aiCoefficientcoefficient.ioChartPixelchartpixel.comRedashredash.io


Data Stories FAQ
How many episodes of Data Stories have been released?
170 full episodes have been released, with a full archive available on the site.
Are transcriptions available for podcast episodes?
Full written transcriptions for all 170 episodes are available, with a searchable archive to browse and search content.
Where can I access code and data associated with episodes?
Episode-related code and data are publicly available on GitHub.
Is something wrong or out of date?
Tell us and an editor will check it.
Own this website?
Claim this listing
Claim the listing and suggest updates yourself. An editor checks every claim first.