

Bricks turns CSV and Excel data into dashboards and reports with AI assistance.
Zola Analytics
Zola Analytics turns plain-language questions into cited research answers, live charts and finished reports using data from multiple sources.
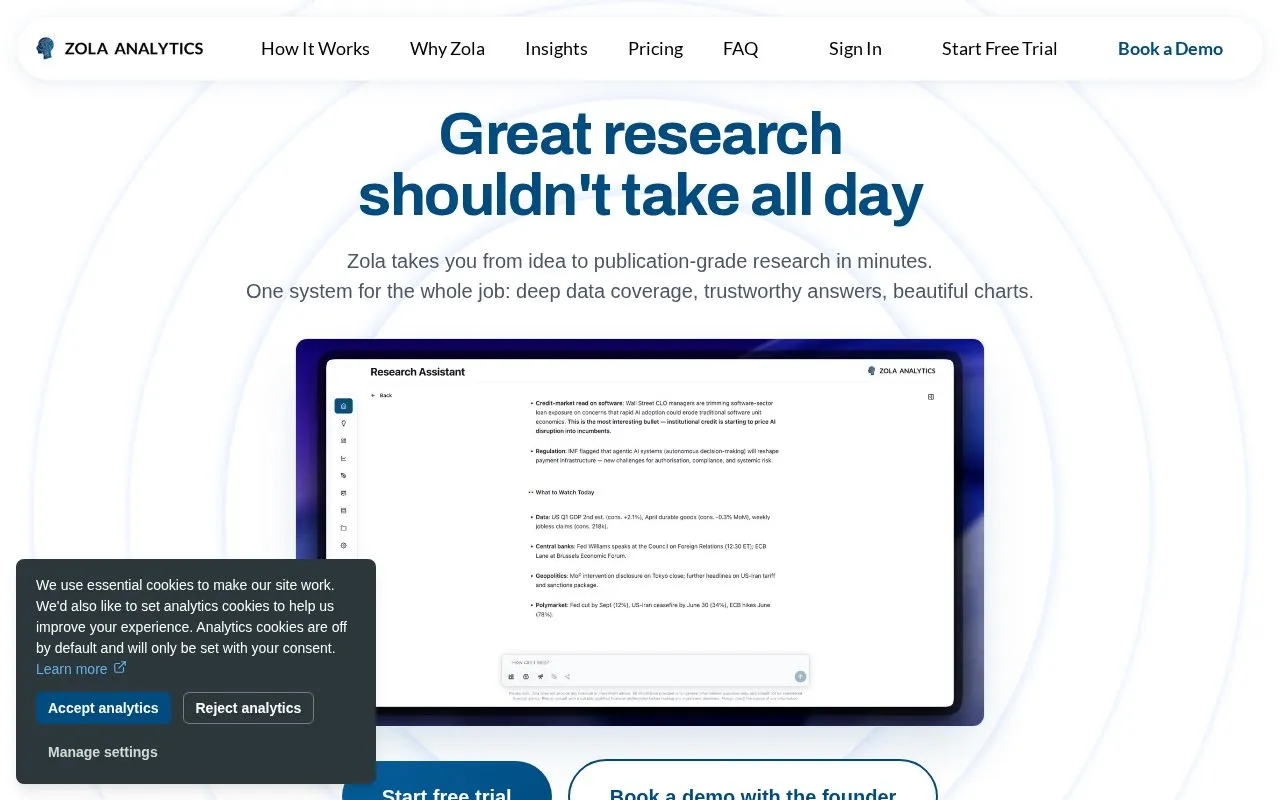
About Zola Analytics
Zola Analytics takes plain-language questions about economies and markets and produces cited answers, live charts and articles. It uses 25 million+ harmonised series from 150+ sources, including central banks, statistics offices, exchanges and market feeds ingested daily into one schema. Capabilities include 21 live chart types with editable pipelines, research reports with claim review, a shared team library, and publishing under the user's own brand with subscriptions. A free trial is offered. Metrics outside the ingested data are listed as not tracked, and charts that fail to build are omitted.
Key features
- Plain-language questions answered with links to source series
- 25M+ harmonised series from 150+ sources ingested daily
- 21 live chart types with open, editable construction pipelines
- Research reports with claim review and evidence grading
- Notes, decks and PDFs assembled from research
- Team library plus publishing under own brand with subscriptions
Best for: Investment teams and independent research providers who analyse economies and markets and publish findings.
Good for
- Every number links to the exact series or document it came from
- Chart pipelines show series and transformations and allow editing
- Units are carried with series and checked through calculations
Watch out for
- Metrics outside the ingested data layer are listed as not tracked
- Charts that fail to build are omitted rather than displayed
Zola Analytics at a glance
- Website
- zolaanalytics.com
- Category
- AI & Machine Learning › AI Data Visualization
- Type
- Website
- Pricing
- Free trial
- Platforms
- Web
- Open source
- Not stated
- Language
- English
- Last checked
- Oct 5, 2026 · Online when checked
- Listed
- Oct 5, 2026
Zola Analytics alternatives
Tools and sites you could use instead, ranked by how closely they match.

This Hugging Face Space lets users upload a CSV, ask questions, and receive AI-generated analysis, visualizations, and answers.

Coefficient connects spreadsheets to CRM, databases, and other data sources, then supports live analysis, dashboards, and automated updates.

RowSpeak analyzes spreadsheets, PDFs, and image tables with AI and creates charts, dashboards, and reports.

Chat2CSV creates charts and visualizations from CSV files using natural-language requests.

Backstory helps sales teams investigate pipeline questions and decide what to do next using AI revenue analysis.
Popular in AI Data Visualization
Well-known listings from the same topic.
Anomaly AIfindanomaly.aiMinusXminusx.aiData Storiesdatastori.esChartPixelchartpixel.comRedashredash.io


Zola Analytics FAQ
What happens if Zola does not track a metric?
It is listed as not tracked, and charts that fail to build are dropped.
Can I use my existing data providers with Zola?
Zola allows plugging data providers into the system.
How can I check a number or chart?
Numbers link to the source series or document, and charts open into the series and transformations used.
Is something wrong or out of date?
Tell us and an editor will check it.
Own this website?
Claim this listing
Claim the listing and suggest updates yourself. An editor checks every claim first.