

Zola Analytics turns plain-language questions into cited research answers, live charts and finished reports using data from multiple sources.
Free trial
17 alternativesBricks turns CSV and Excel data into dashboards and reports with AI assistance.
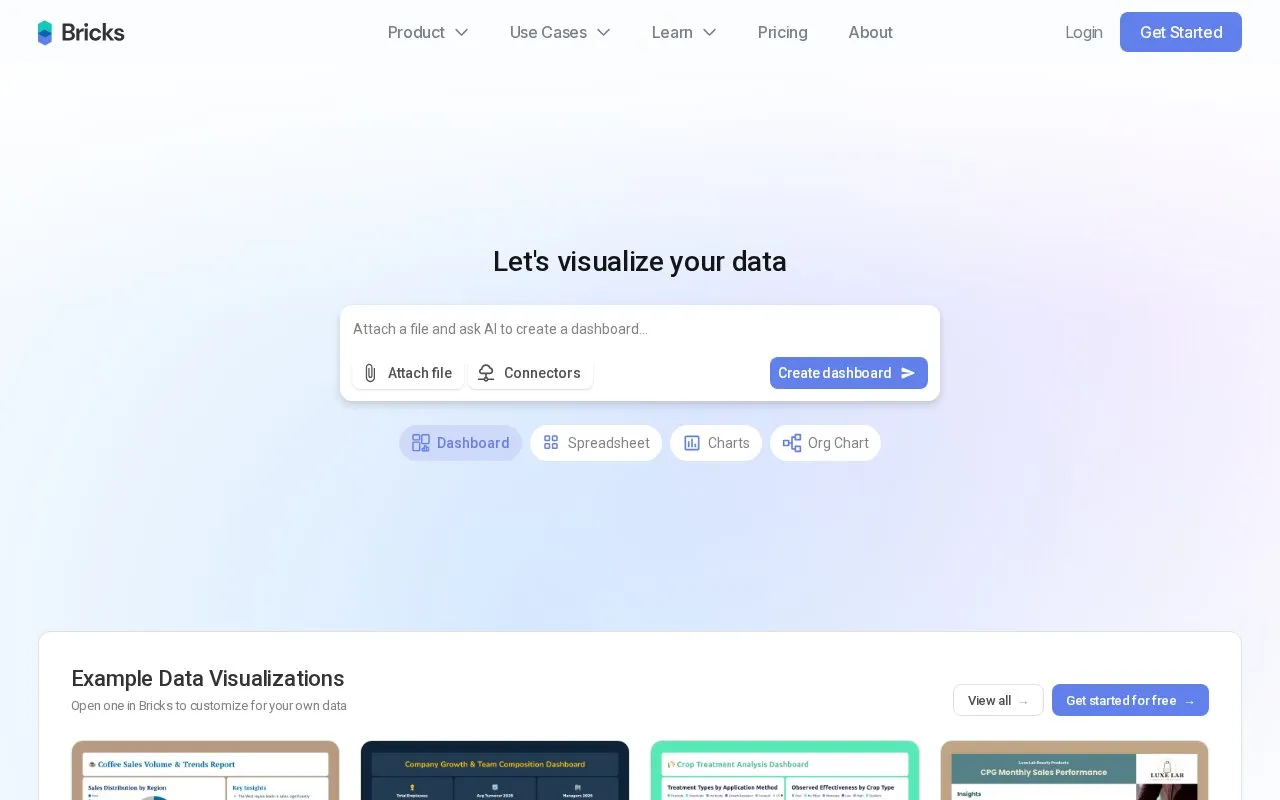
Bricks is a web-based tool that turns CSV and Excel data into dashboards and reports with AI assistance. Users upload spreadsheet data to generate charts and layouts, which can then be adjusted manually or with natural language instructions.
The site lists example dashboards for topics such as sales performance, cash flow, bookings, and admissions that can be opened and customized. It supports drag-and-drop editing, interactive filtering by clicking data points, and visual themes. Users can also import from Google Sheets or databases.
It suits people who work with spreadsheet exports and need regular dashboards or reports without manual chart building in Excel or using complex BI tools. This includes managers and staff reporting on sales, operations, or performance data from CSV files.
Tools and sites you could use instead, ranked by how closely they match.
Zola Analytics turns plain-language questions into cited research answers, live charts and finished reports using data from multiple sources.
RowSpeak analyzes spreadsheets, PDFs, and image tables with AI and creates charts, dashboards, and reports.
ChartPixel analyzes spreadsheets and survey data with AI and produces interactive charts, reports, and dashboards.
Anomaly analyzes large spreadsheets and business datasets to create verifiable reports and interactive dashboards.
A podcast on data visualization with Enrico Bertini and Moritz Stefaner.
Coefficient connects spreadsheets to CRM, databases, and other data sources, then supports live analysis, dashboards, and automated updates.
Well-known listings from the same topic.
Tell us and an editor will check it.
Claim the listing and suggest updates yourself. An editor checks every claim first.


