

Dataline lets users analyze and visualize data from files and databases through a chat interface.
Open source
17 alternativesTensorBoard is TensorFlow’s toolkit for visualizing machine learning data and model activity.
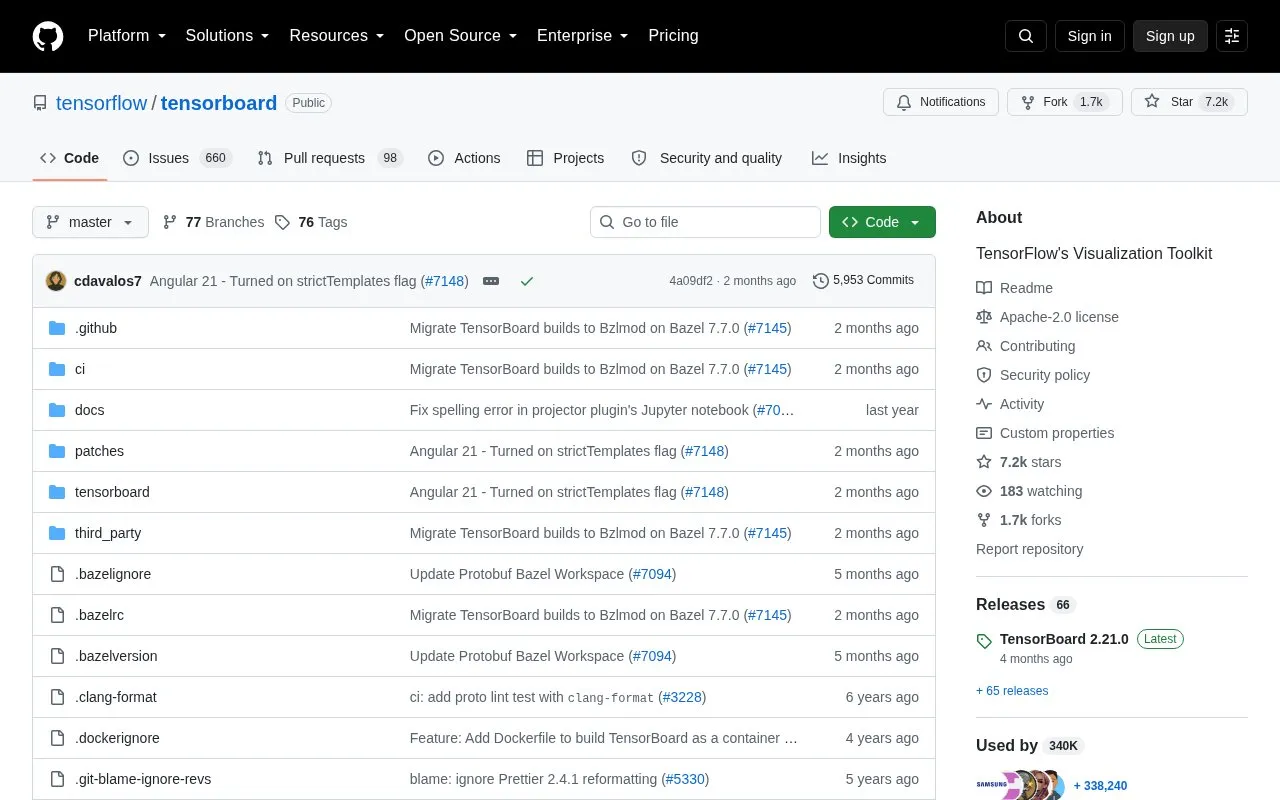
TensorBoard is a suite of web applications from TensorFlow for inspecting and understanding TensorFlow runs and graphs. It reads event files from a log directory and presents visualizations covering scalars, images, audio, text, histograms and graphs, with tags used to organize data in the front end.
It is designed to run entirely offline, for example on a local machine, behind a corporate firewall, or in a datacenter. Before starting it, users must generate summary data in a log directory with a summary writer; the tool requires a logdir to read logs from. After launch it is accessed at http://localhost:6006, and it is intended for use in Google Chrome or Firefox, though other browsers may work with possible bugs or performance issues.
Tools and sites you could use instead, ranked by how closely they match.
Dataline lets users analyze and visualize data from files and databases through a chat interface.
Bricks turns CSV and Excel data into dashboards and reports with AI assistance.
MinusX organizes company data and uses agents in an agentic business intelligence platform.
Zola Analytics turns plain-language questions into cited research answers, live charts and finished reports using data from multiple sources.
A podcast on data visualization with Enrico Bertini and Moritz Stefaner.
Coefficient connects spreadsheets to CRM, databases, and other data sources, then supports live analysis, dashboards, and automated updates.
Well-known listings from the same topic.
Tell us and an editor will check it.
Claim the listing and suggest updates yourself. An editor checks every claim first.


