

DataLine lets users chat with data and generate tables, charts, and dashboards through AI-driven analysis and visualization.
ChartPixel
ChartPixel analyzes spreadsheets and survey data with AI and produces interactive charts, reports, and dashboards.
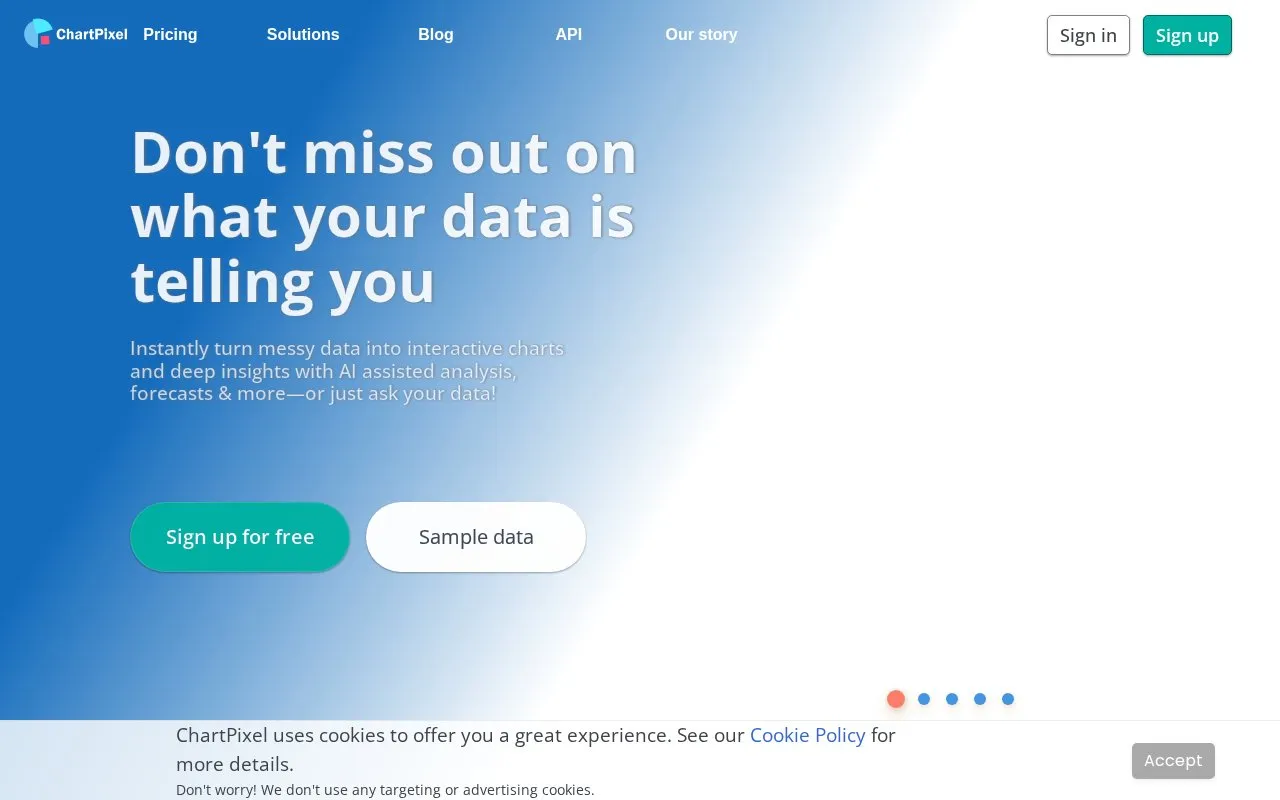
About ChartPixel
ChartPixel is a web-based AI data analysis and visualization tool. It accepts Excel, CSV, or data read from websites, then cleans and analyzes the data to produce interactive charts, statistics, forecasts, and written insights without requiring users to select columns or chart types. Users can chat with their data and charts, create one-click presentation slides, embed or share charts online, and export to PowerPoint. The homepage states the tool does not train on user data or send raw data to external LLMs. Pricing details are not provided.
Key features
- Upload Excel or CSV files, or read tables from websites.
- Automatically clean, wrangle, and analyze data without manual column or chart selection.
- Generate interactive charts with written insights, statistics, forecasts, and key takeaways.
- Chat with data and charts to uncover key information.
- Create one-click presentation slides, export to PowerPoint, embed and share online.
- Sentiment analysis from comments and maps from zip codes.
Best for: Researchers, business analysts, and beginners who need to turn messy spreadsheets or survey data into interactive charts and insights without coding.
Good for
- No-code platform suitable for beginners and professionals.
- AI-assisted analysis rooted in robust statistics with charts explained by written insights.
- States it does not train on user data or send raw data to external LLMs.
Watch out for
- Pricing information is not provided on the homepage.
- Requires uploading data or reading tables; no offline use mentioned.
ChartPixel at a glance
- Website
- chartpixel.com
- Category
- AI & Machine Learning › AI Data Visualization
- Type
- Online tool
- Pricing
- Not confirmed. Check the site
- Platforms
- Web
- Open source
- Not stated
- Language
- English
- Last checked
- Oct 6, 2026 · Online when checked
- Listed
- Oct 5, 2026
ChartPixel alternatives
Tools and sites you could use instead, ranked by how closely they match.

Dataline lets users analyze and visualize data from files and databases through a chat interface.
Open source
17 alternatives
Anomaly analyzes large spreadsheets and business datasets to create verifiable reports and interactive dashboards.

RowSpeak analyzes spreadsheets, PDFs, and image tables with AI and creates charts, dashboards, and reports.

Coefficient connects spreadsheets to CRM, databases, and other data sources, then supports live analysis, dashboards, and automated updates.

Zola Analytics turns plain-language questions into cited research answers, live charts and finished reports using data from multiple sources.
Free trial
17 alternativesPopular in AI Data Visualization
Well-known listings from the same topic.


ChartPixel FAQ
What file types can I upload?
Excel and CSV files; you can also read tables from websites or use keyword search.
Does ChartPixel train on my data?
The homepage states it does not train on your data or send raw data back and forth to external LLMs.
Can I export or share charts?
Yes, you can export into PowerPoint in a click, share online, and embed charts.
Is something wrong or out of date?
Tell us and an editor will check it.
Own this website?
Claim this listing
Claim the listing and suggest updates yourself. An editor checks every claim first.