

ChartPixel analyzes spreadsheets and survey data with AI and produces interactive charts, reports, and dashboards.
RowSpeak
RowSpeak analyzes spreadsheets, PDFs, and image tables with AI and creates charts, dashboards, and reports.
About RowSpeak
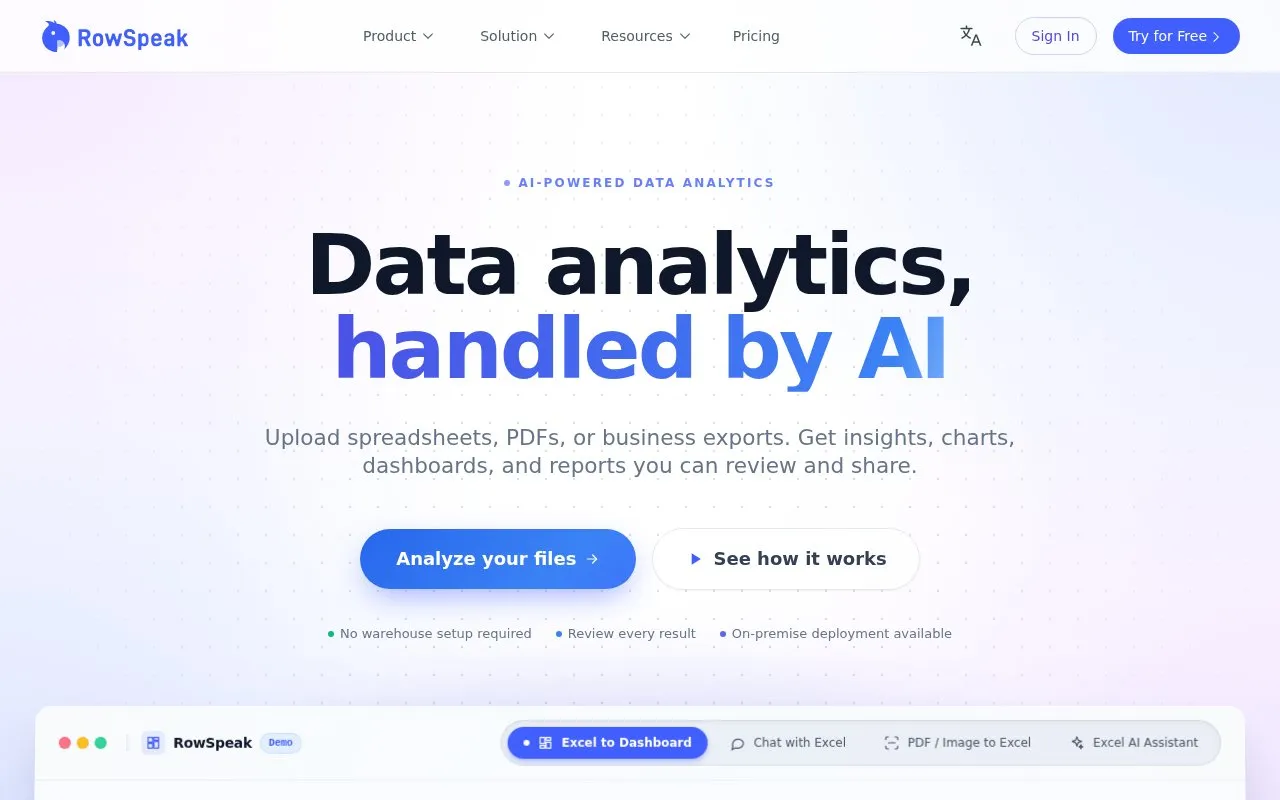
RowSpeak is an AI-powered data analytics tool that works on files users already have, such as Excel workbooks, CSV files, PDF tables, screenshots, and exported business reports. Users upload data, ask questions in plain language, and get back insights, charts, dashboards, KPI views, and report-ready summaries they can review and share. It also handles table extraction from images and PDFs, converting multi-page scans and receipts into native Excel output.
A recurring reporting engine lets users save questions, metrics, and checks so that when an updated week or month file arrives, RowSpeak auto-maps fields, recalculates variances against a prior benchmark, and compiles summaries. The homepage states no data warehouse setup is required and that on-premise deployment is available. The tool is presented as an aid that produces reviewable results; the site advises checking assumptions before sharing. Pricing is not stated.
Key features
- Analyzes Excel, CSV, PDF tables, screenshots and business exports
- Extracts nested tables, receipts and scanned documents into native .xlsx
- Creates charts, dashboards, KPI views and report-ready summaries
- Answers plain-language questions and comparisons about uploaded data
- Automates recurring reports by recalculating variances when updated files arrive
- On-premise deployment available; no data warehouse setup required
Best for: Business, finance and operations teams that work from spreadsheets, PDFs and exported reports and want charts, dashboards and recurring summaries without a data warehouse.
Good for
- Handles messy inputs including multi-page scans, smartphone photos, merged cells and nested tables
- Outputs span Excel, CSV, image, PowerPoint, charts, KPI views and report-ready summaries
- On-premise deployment option is stated as available, with no warehouse setup required
Watch out for
- No pricing information is provided on the homepage
- The site advises reviewing assumptions before sharing results, so output is not presented as final
RowSpeak at a glance
- Website
- rowspeak.ai
- Category
- AI & Machine Learning › AI Data Visualization
- Type
- Website
- Pricing
- Not confirmed. Check the site
- Platforms
- Web
- Open source
- Not stated
- Language
- English
- Last checked
- Oct 6, 2026 · Online when checked
- Listed
- Oct 5, 2026
RowSpeak alternatives
Tools and sites you could use instead, ranked by how closely they match.

Anomaly analyzes large spreadsheets and business datasets to create verifiable reports and interactive dashboards.

DataLine lets users chat with data and generate tables, charts, and dashboards through AI-driven analysis and visualization.

Zola Analytics turns plain-language questions into cited research answers, live charts and finished reports using data from multiple sources.
Free trial
17 alternatives
Bricks turns CSV and Excel data into dashboards and reports with AI assistance.

Coefficient connects spreadsheets to CRM, databases, and other data sources, then supports live analysis, dashboards, and automated updates.
Popular in AI Data Visualization
Well-known listings from the same topic.


RowSpeak FAQ
What kinds of files can I upload?
Excel and CSV spreadsheets, PDF tables, screenshots and images, and exported business reports. PDF, JPG, PNG and scanned documents are supported for image and PDF extraction.
What output formats does it produce?
Supported outputs listed include Excel, CSV, image, PowerPoint, charts, KPI views, pattern explanations, and report-ready summaries.
Can it reuse a report setup for new data?
Yes. Saved questions, metrics and sanity checks can be re-run when an updated month or week file arrives, auto-mapping fields and calculating the delta against a prior benchmark.
Is something wrong or out of date?
Tell us and an editor will check it.
Own this website?
Claim this listing
Claim the listing and suggest updates yourself. An editor checks every claim first.