

Coefficient connects spreadsheets to CRM, databases, and other data sources, then supports live analysis, dashboards, and automated updates.
Redash
Redash connects to data sources so users can query, visualize, and share company data.
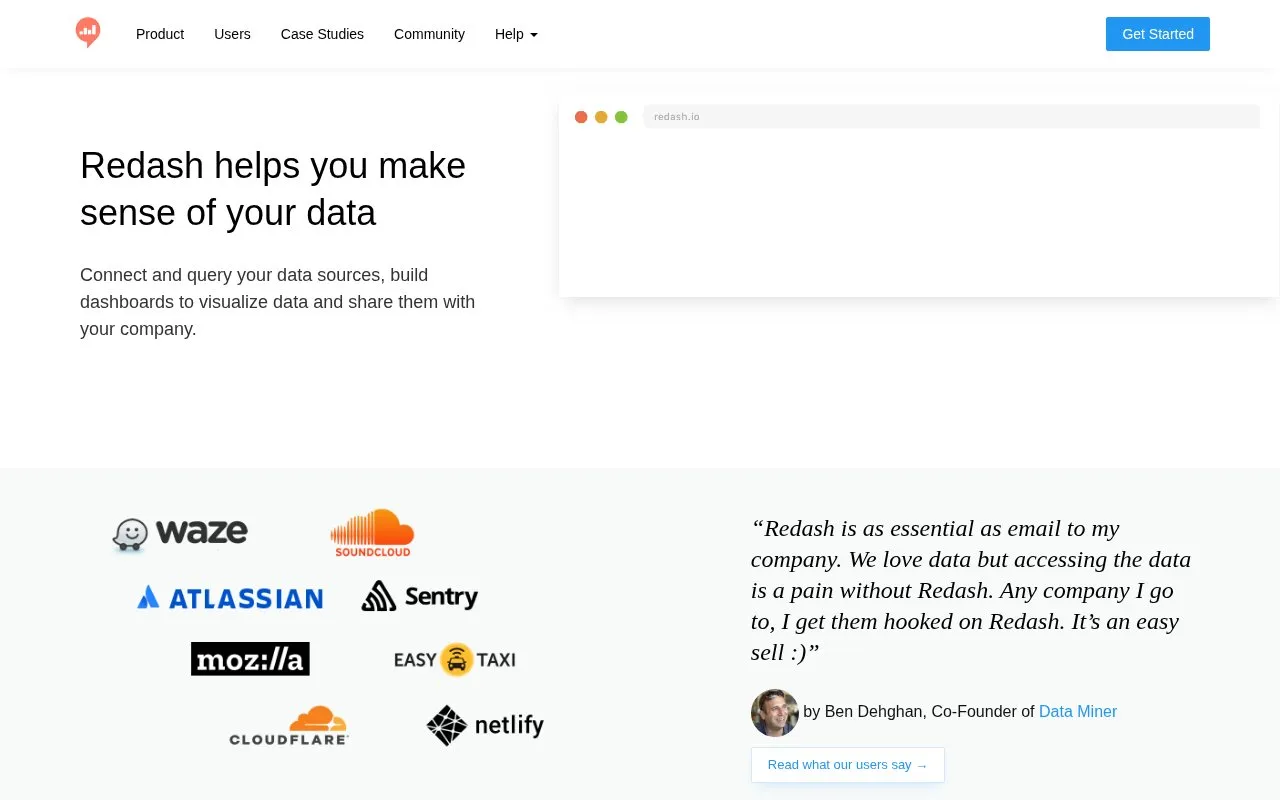
About Redash
Redash is a web-based service for connecting to data sources, writing and running queries, building dashboards, and sharing results with a team. The homepage lists PostgreSQL, MySQL, Redshift, BigQuery and MongoDB as examples of supported sources and says it also works with many others, including SQL, NoSQL, big data and API sources. Its SQL editor includes schema browsing, click-to-insert and reusable snippets. Dashboards can be arranged by dragging and resizing visualizations, refreshed on a schedule, and shared with a team or with the public.
The homepage describes Redash as a cloud-based service. Pricing is not stated on the homepage, so available plans and costs are unknown. Because dashboards can be shared publicly, users who handle sensitive company data should review sharing settings before publishing.
Key features
- Connects to SQL, NoSQL, big data and API data sources
- Online SQL editor with schema browsing and click-to-insert
- Reusable query snippets
- Drag-and-drop dashboards with resizable visualizations
- Scheduled refresh from connected data sources
- Dashboard sharing with a team or with the public
Best for: Teams within a company that need to query shared data sources with SQL and share dashboards with colleagues.
Good for
- Supports many data sources, including PostgreSQL, MySQL, Redshift, BigQuery and MongoDB
- Combines an SQL editor with dashboards and sharing in one web service
- Dashboards can be refreshed on a schedule from the data sources
Redash at a glance
- Website
- redash.io
- Category
- AI & Machine Learning › AI Data Visualization
- Type
- Online tool
- Pricing
- Not confirmed. Check the site
- Platforms
- Web
- Open source
- Not stated
- Last checked
- Oct 6, 2026 · Online when checked
- Listed
- Oct 5, 2026
Redash alternatives
Tools and sites you could use instead, ranked by how closely they match.

MinusX organizes company data and uses agents in an agentic business intelligence platform.

Dataline lets users analyze and visualize data from files and databases through a chat interface.
Open source
17 alternatives
ChartPixel analyzes spreadsheets and survey data with AI and produces interactive charts, reports, and dashboards.

Zola Analytics turns plain-language questions into cited research answers, live charts and finished reports using data from multiple sources.
Free trial
17 alternatives
DataLine lets users chat with data and generate tables, charts, and dashboards through AI-driven analysis and visualization.
Popular in AI Data Visualization
Well-known listings from the same topic.


Redash FAQ
Which data sources does Redash connect to?
The homepage names PostgreSQL, MySQL, Redshift, BigQuery and MongoDB and says it connects to many others. It states that it supports SQL, NoSQL, big data and API data sources.
Can dashboards be shared with people outside a team?
The homepage says dashboards can be shared with a team or with the public.
Can dashboard data be refreshed automatically?
The homepage says refresh can be scheduled from data sources.
Is something wrong or out of date?
Tell us and an editor will check it.
Own this website?
Claim this listing
Claim the listing and suggest updates yourself. An editor checks every claim first.