
SankeyMATIC
SankeyMATIC builds flow diagrams for comparing quantities across stages, with examples covering budgets, results, and processes.
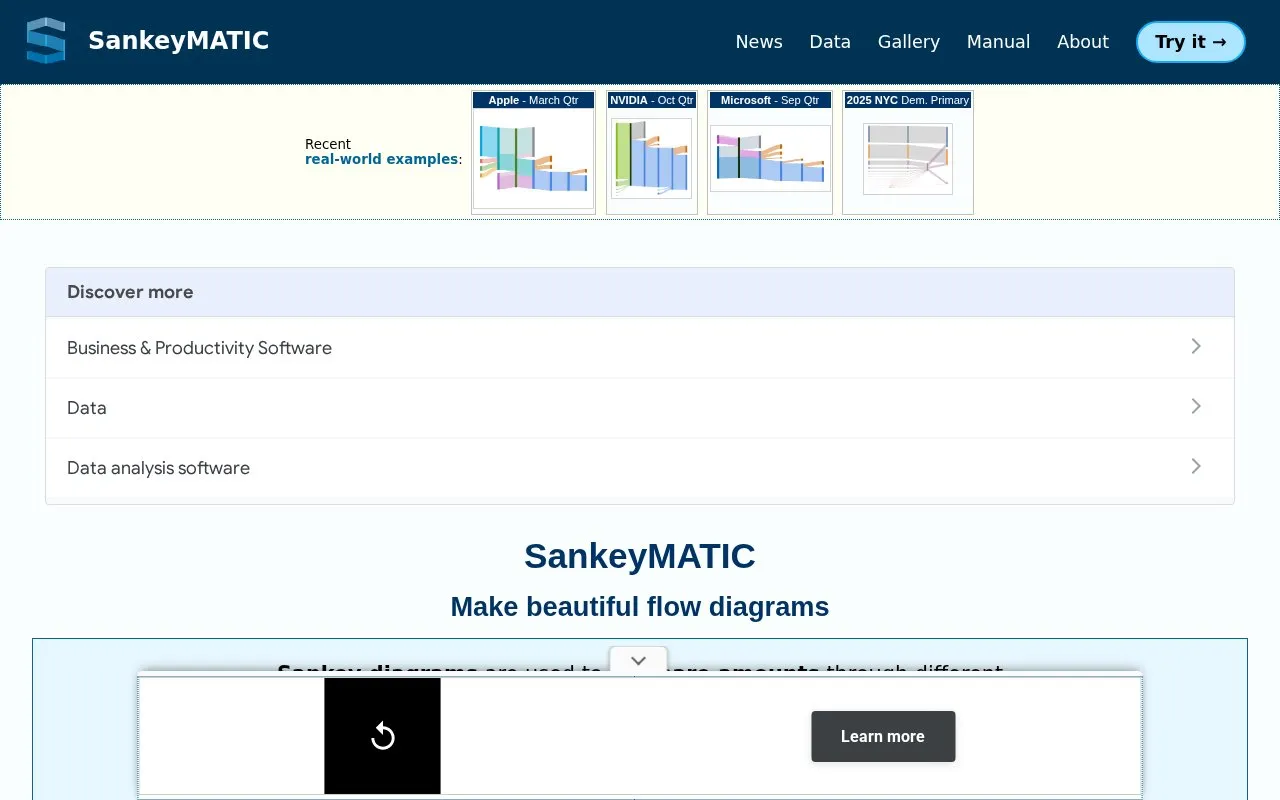
About SankeyMATIC
SankeyMATIC is a browser-based tool for building Sankey diagrams, which show amounts moving through different stages. Typical uses include budgets, financial results, application processes, and multi-round elections. Flows are entered as simple lines in the form "Source [Amount] Target", and a set of interactive controls lets you adjust how the finished diagram looks.
Diagrams can be exported as high-resolution PNG images in several sizes or as SVG vector files for embedding in a web page or importing into a vector editor. The current state of a diagram can also be saved as a readable plain text file, so work can be resumed later on any computer or browser and versions can be compared by diffing source files. No installs, code, email address, or trial signup are required. No pricing details are stated on the homepage.
Key features
- Build flow diagrams by entering "Source [Amount] Target" lines
- Interactive controls for customizing diagram appearance
- Export high-resolution PNG images at multiple sizes
- Export SVG vector files for web pages or vector editors
- Save work state as a plain text file to resume later
- Compare diagram versions by diffing the saved source files
Best for: People who need to visualize budgets, financial results, or multi-stage processes as flow diagrams without installing software or creating an account.
Good for
- No extensions to install, no code to write, and no email address or trial signup needed
- Exports both raster PNG images and vector SVG files
- Plain text save files let users resume work on any browser and compare versions
Watch out for
- Runs only in a web browser
- No pricing information is stated on the homepage
SankeyMATIC at a glance
- Website
- sankeymatic.com
- Category
- Design & Creative › Charts & Data Visualization
- Type
- Online tool
- Pricing
- Not confirmed. Check the site
- Platforms
- Web
- Open source
- Not stated
- Language
- English
- Last checked
- Oct 6, 2026 · Online when checked
- Listed
- Oct 5, 2026
Guides for Charts & Data Visualization
SankeyMATIC alternatives
Tools and sites you could use instead, ranked by how closely they match.

Kroki provides one API for generating diagrams from textual descriptions using libraries such as Mermaid, PlantUML, Graphviz, and D2.

UMLet provides free, open source UML drawing with a simple interface for making diagrams, including sequence and activity diagrams.
PlantText provides an online editor for PlantUML code and generates class, sequence, activity, and state diagrams.

text2diagram creates diagrams and charts from text descriptions, with real-time collaboration and document permissions listed on its page.

Kroki CLI converts diagram files through the Kroki service, inferring diagram type from the file extension by default.
Open source
24 alternatives
PlantUML generates UML and other diagrams from textual descriptions and exports results in formats including PNG, SVG, and PDF.
Popular in Charts & Data Visualization
Well-known listings from the same topic.
Data GIF Makerdatagifmaker.withgoogle.comDatawrapperdatawrapper.deDataVizCataloguedatavizcatalogue.comLineGraphMakerlinegraphmaker.coaltairaltair-viz.github.ioCharts Buildercharts.hohli.com


SankeyMATIC FAQ
Do I need to install anything or sign up?
No. There are no extensions to install and no code to write, and you do not have to enter an email address or sign up for a trial period.
What export formats are available?
Diagrams can be exported as a high-resolution PNG image in multiple sizes, or as an SVG vector file suitable for embedding in a web page or importing into a vector graphics editor.
Can I return to a diagram later?
Yes. You can save the current state of your work in a readable plain text file, then resume on any computer or browser, and compare versions by looking at differences between source files.
Is something wrong or out of date?
Tell us and an editor will check it.
Own this website?
Claim this listing
Claim the listing and suggest updates yourself. An editor checks every claim first.