

LineGraphMaker
Line Graph Maker builds customizable line charts from labels and data values, with image export available from the page.
About LineGraphMaker
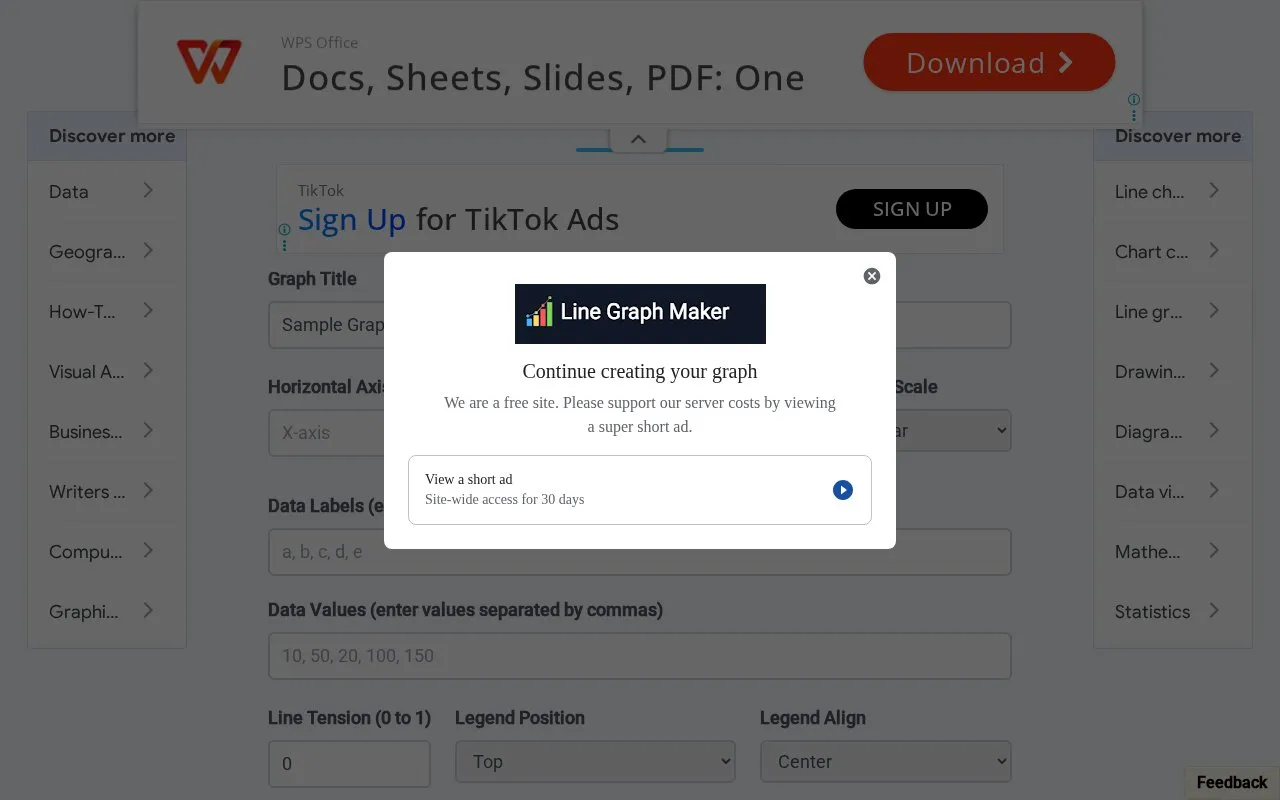
LineGraphMaker builds line charts from labels and values entered as comma-separated text. Users can add a graph title and horizontal and vertical axis labels, select linear or logarithmic Y-axis scaling, adjust line tension from 0 to 1, choose line color, set legend position and alignment, control X and Y grid lines and point display, and choose whether the Y axis starts at 0. Charts can be downloaded as PNG, JPG, or SVG.
Key features
- Build line charts from comma-separated labels and values
- Add graph title with horizontal and vertical axis labels
- Select linear or logarithmic Y-axis scale
- Adjust line tension and line color
- Set legend position and alignment, grid lines, points, and axis start
- Download chart as PNG, JPG, or SVG
Best for: People who need to create line charts from manually entered labels and values.
Good for
- Offers PNG, JPG, and SVG downloads from the page
- Supports linear and logarithmic Y-axis scales
- Allows adjustment of legend, grid lines, points, and line appearance
LineGraphMaker at a glance
- Website
- linegraphmaker.co
- Category
- Design & Creative › Charts & Data Visualization
- Type
- Website
- Pricing
- Not confirmed. Check the site
- Platforms
- Web
- Open source
- Not stated
- Last checked
- Oct 5, 2026 · Online when checked
- Listed
- Oct 5, 2026
Guides for Charts & Data Visualization
LineGraphMaker alternatives
Tools and sites you could use instead, ranked by how closely they match.

Histogram Maker creates customizable histograms from entered values or imported CSV and Excel data, with image download options.

Pie Chart Maker creates customizable pie charts and lets users download them as JPG, PNG, or SVG files.
Free
24 alternatives
BarGraphMaker creates customizable bar charts that users can download as JPG, PNG, or SVG images.

The Chart.xkcd library creates charts in an xkcd style, with examples for line, XY, bar, pie, and radar charts.

Bar, line, area, and scatter charts can be created with dimple, an open-source charting API for D3.js.
Open source
24 alternatives
Graph Online creates graphs and applies algorithms for shortest paths, adjacency matrices, and minimum spanning trees.
Popular in Charts & Data Visualization
Well-known listings from the same topic.
Data GIF Makerdatagifmaker.withgoogle.comDatawrapperdatawrapper.deDataVizCataloguedatavizcatalogue.comaltairaltair-viz.github.ioCharts Buildercharts.hohli.comPlantUMLplantuml.com


LineGraphMaker FAQ
How do I enter data for the chart?
Enter data labels separated by commas and data values separated by commas.
What export formats are available?
The page lists PNG, JPG, and SVG downloads.
How do I create a line graph?
Add a title and axis labels, enter labels and values, adjust tension, legend, grid lines, and axis start, then download the graph.
Is something wrong or out of date?
Tell us and an editor will check it.
Own this website?
Claim this listing
Claim the listing and suggest updates yourself. An editor checks every claim first.