

Chart.xkcd
The Chart.xkcd library creates charts in an xkcd style, with examples for line, XY, bar, pie, and radar charts.
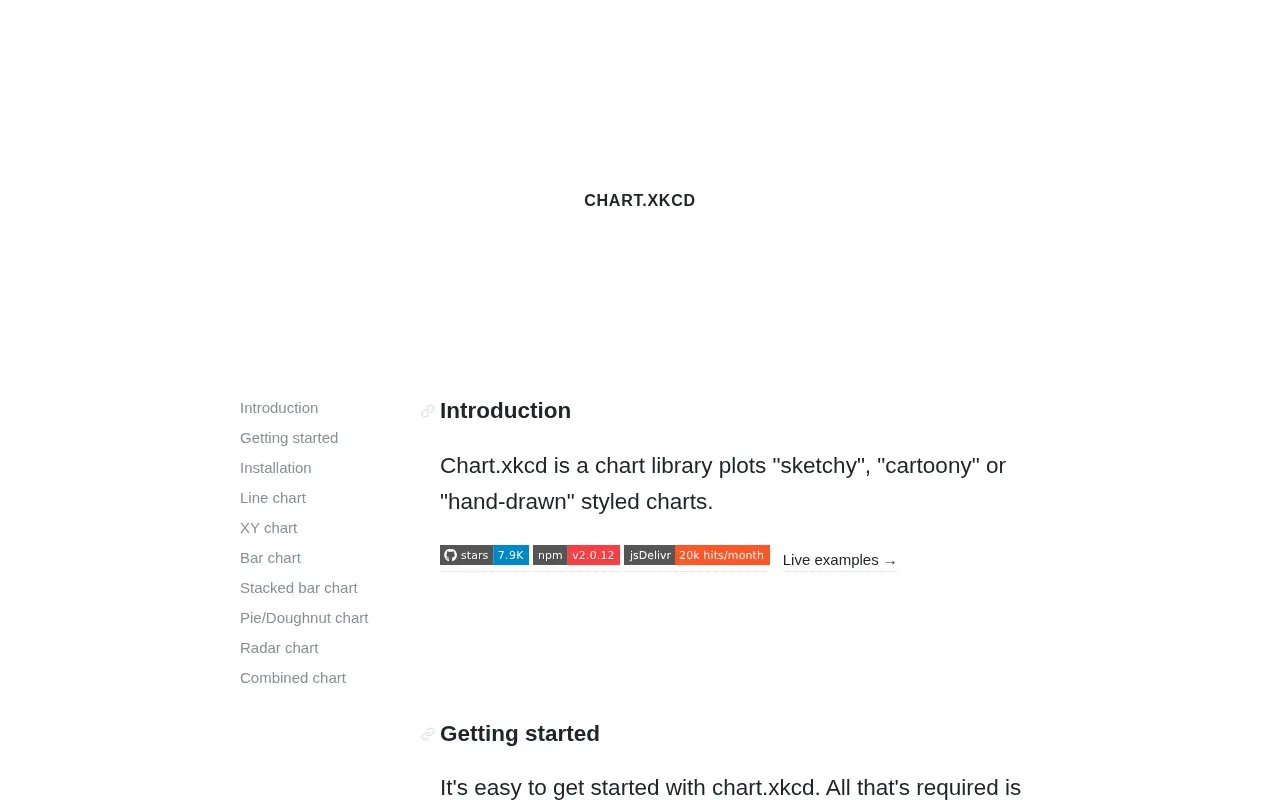
About Chart.xkcd
Chart.xkcd is a JavaScript chart library that renders charts in a sketchy, hand-drawn or cartoony xkcd style. It supports line, XY, bar, stacked bar, pie/doughnut, radar and combined charts. To use it, include the script in a page along with an SVG node, then instantiate a chart type such as chartXkcd.Line with data and options. Installation is possible via a CDN script tag or npm. Options allow customization of colors, fonts, legend position, tick counts, stroke and background colors, and the xkcd effect can be disabled with unxkcdify. XY charts can use dayjs for time formatting.
Key features
- Renders line, XY, bar, stacked bar, pie/doughnut, radar and combined charts.
- Adds a sketchy hand-drawn xkcd effect, with an option to disable it.
- Installs via a CDN script tag or the npm package.
- Customizes colors, font family, legend position, stroke and background colors.
- Uses dayjs to format time values on XY charts.
- React and Vue wrappers are listed as available.
Best for: Web developers who want to add informal, hand-drawn-style charts to a page.
Good for
- Supports many chart types, including line, XY, bar, stacked bar, pie, radar.
- Can be installed through a CDN script tag or npm.
- Offers customization of colors, fonts, legend position, stroke and background.
Watch out for
- Requires including a script and an SVG node in the page.
- Pricing and license terms are not stated on the homepage.
Chart.xkcd at a glance
- Website
- timqian.com/chart.xkcd
- Category
- Design & Creative › Charts & Data Visualization
- Type
- Website
- Pricing
- Not confirmed. Check the site
- Platforms
- Web
- Open source
- Not stated
- Last checked
- Oct 6, 2026 · Online when checked
- Listed
- Oct 5, 2026
Guides for Charts & Data Visualization
Chart.xkcd alternatives
Tools and sites you could use instead, ranked by how closely they match.

Line Graph Maker builds customizable line charts from labels and data values, with image export available from the page.

Bar, line, area, and scatter charts can be created with dimple, an open-source charting API for D3.js.
Open source
24 alternativesSankeyMATIC builds flow diagrams for comparing quantities across stages, with examples covering budgets, results, and processes.

text2diagram creates diagrams and charts from text descriptions, with real-time collaboration and document permissions listed on its page.

BarGraphMaker creates customizable bar charts that users can download as JPG, PNG, or SVG images.

Svgbob converts text-based ASCII diagrams into SVG graphics, with both a library and command-line interface.
Open source
24 alternativesPopular in Charts & Data Visualization
Well-known listings from the same topic.
Data GIF Makerdatagifmaker.withgoogle.comDatawrapperdatawrapper.deDataVizCataloguedatavizcatalogue.comaltairaltair-viz.github.ioCharts Buildercharts.hohli.comPie Chart Makerpiechartmaker.co


Chart.xkcd FAQ
How do I install Chart.xkcd?
Include the script via a script tag from a CDN, or install with npm using 'npm i chart.xkcd'.
What chart types does Chart.xkcd support?
Line, XY, bar, stacked bar, pie/doughnut, radar and combined charts.
Can I turn off the xkcd hand-drawn effect?
Yes, set the unxkcdify option to true.
Is something wrong or out of date?
Tell us and an editor will check it.
Own this website?
Claim this listing
Claim the listing and suggest updates yourself. An editor checks every claim first.