

dimple
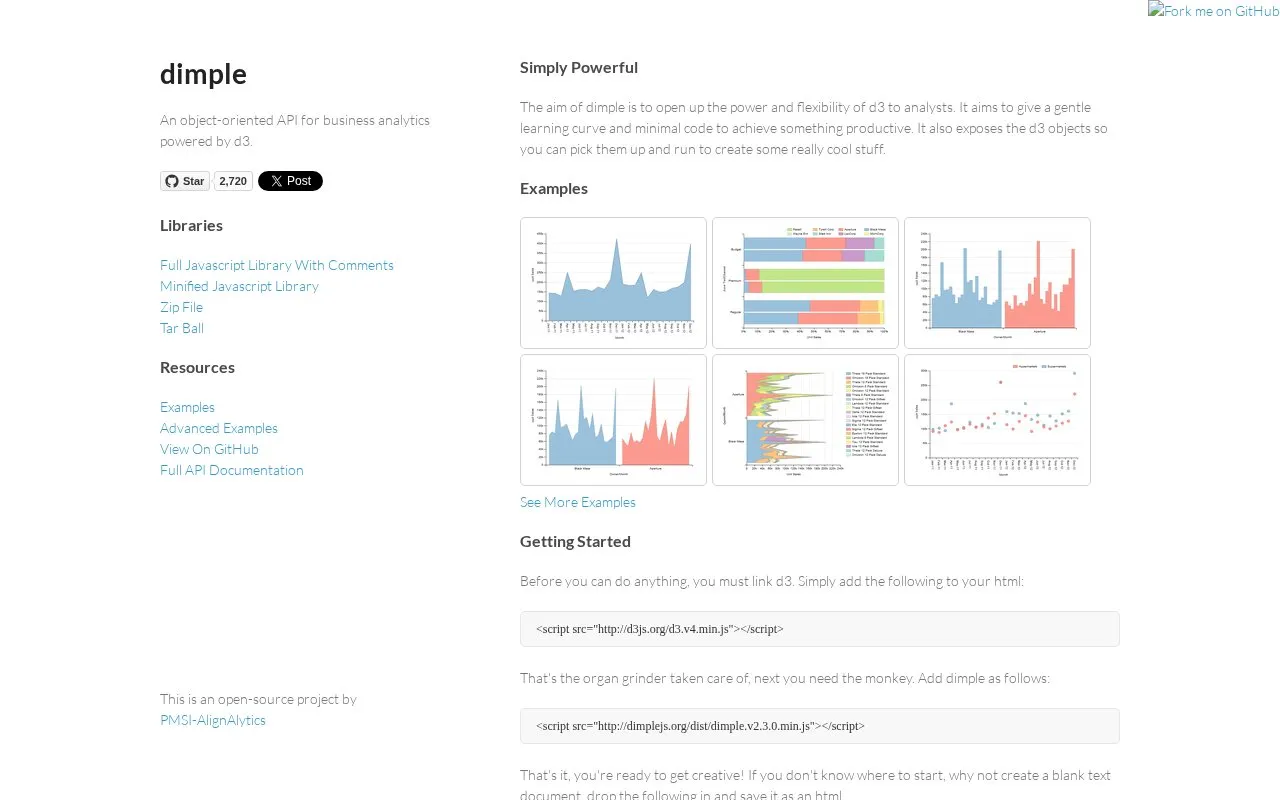
Bar, line, area, and scatter charts can be created with dimple, an open-source charting API for D3.js.
About dimple
dimple is an object-oriented API for business analytics powered by d3. It is aimed at analysts and seeks a gentle learning curve with minimal code. It creates and combines bar, line, area and scatter charts and exposes the underlying d3 objects for further customization. Use requires linking d3 separately before adding dimple.
Pricing is not clearly stated.
Key features
- Create an SVG container with specified dimensions
- Add category and measure axes to a chart
Best for: Analysts who want to create D3-based charts with minimal code.
dimple at a glance
- Website
- dimplejs.org
- Category
- Design & Creative › Charts & Data Visualization
- Type
- Online tool
- Pricing
- Not confirmed. Check the site
- Platforms
- Web
- Details verified
- Oct 22, 2026 · Official source
- Open source
- Yes · Source code
- Last checked
- Oct 5, 2026 · Online when checked
- Listed
- Oct 5, 2026
Guides for Charts & Data Visualization
dimple alternatives
Tools and sites you could use instead, ranked by how closely they match.

Line Graph Maker builds customizable line charts from labels and data values, with image export available from the page.

The Chart.xkcd library creates charts in an xkcd style, with examples for line, XY, bar, pie, and radar charts.

Interactive charts for multidimensional datasets can be built with dc.js, a JavaScript library that supports Crossfilter.

Pie Chart Maker creates customizable pie charts and lets users download them as JPG, PNG, or SVG files.
Free
24 alternatives
amCharts provides JavaScript charting components, maps, stock charts, and Gantt charts.

Svgbob converts text-based ASCII diagrams into SVG graphics, with both a library and command-line interface.
Open source
24 alternativesPopular in Charts & Data Visualization
Well-known listings from the same topic.
Data GIF Makerdatagifmaker.withgoogle.comDatawrapperdatawrapper.deDataVizCataloguedatavizcatalogue.comaltairaltair-viz.github.ioCharts Buildercharts.hohli.comPlantUMLplantuml.com


Is something wrong or out of date?
Tell us and an editor will check it.
Own this website?
Claim this listing
Claim the listing and suggest updates yourself. An editor checks every claim first.