

histogrammaker
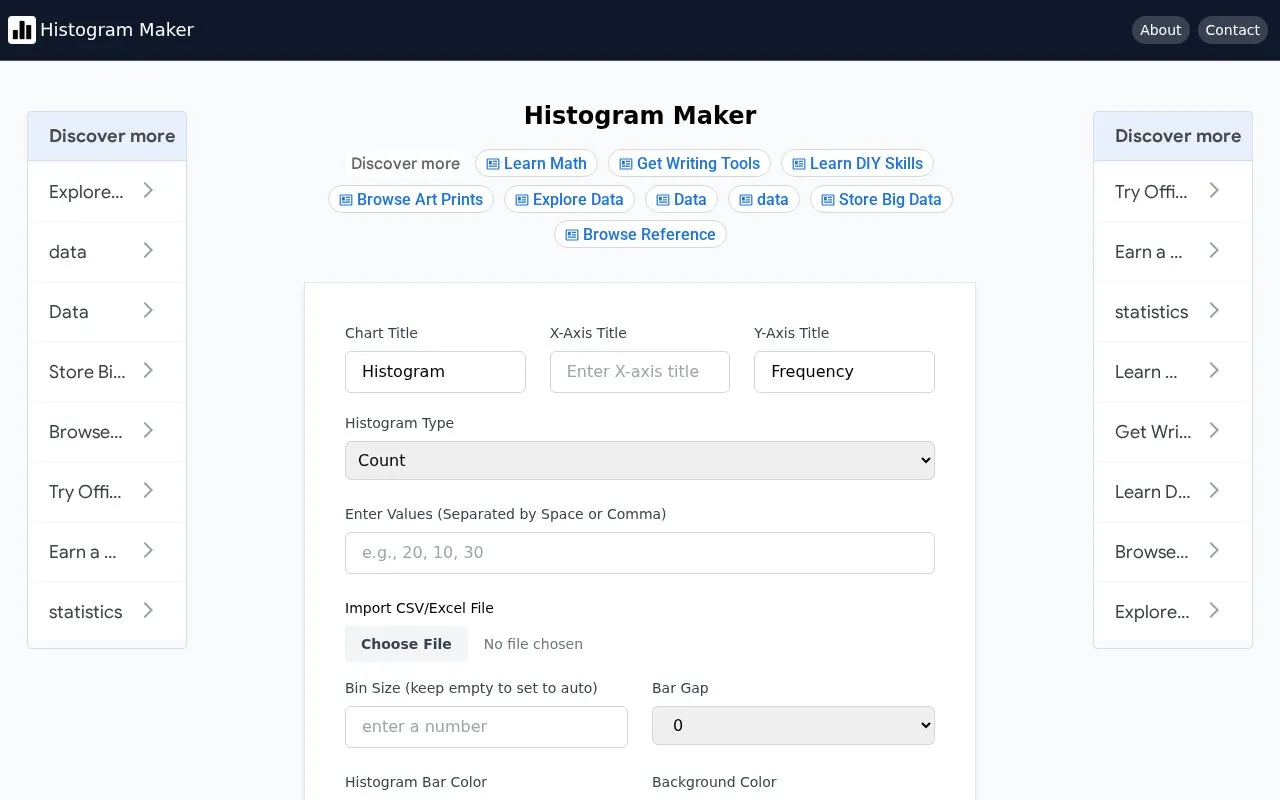
Histogram Maker creates customizable histograms from entered values or imported CSV and Excel data, with image download options.
About histogrammaker
Histogram Maker is a free web tool for creating histograms, a chart that shows how numerical data is distributed across ranges called bins. Users can enter values separated by spaces or commas, or import CSV or Excel files. The homepage meta description says histograms can be created for free, but it does not give further pricing details.
The tool offers count, probability density, and cumulative histogram types. Bin size can be set automatically or entered as a custom interval. Chart title, axis titles, axis ranges, bar color, background color, title color, and axis text color can be adjusted. Finished charts can be downloaded as PNG, JPEG, or SVG files. The homepage states that the interface works on both desktop and mobile devices.
Key features
- Enter values manually, separated by spaces or commas
- Import data from CSV or Excel files
- Count, probability density, and cumulative histogram types
- Automatic bin sizing or custom bin intervals
- Adjustable bar, background, title, and axis text colors
- Download as PNG, JPEG, or SVG image
Best for: People who need to create histograms quickly for reports, presentations, coursework, or data analysis without installing specialized software.
Good for
- Accepts CSV and Excel files as well as manually entered values
- Exports charts in PNG, JPEG, and SVG formats
- Works on desktop and mobile devices, according to the homepage
histogrammaker at a glance
- Website
- histogrammaker.net
- Category
- Design & Creative › Charts & Data Visualization
- Type
- Online tool
- Pricing
- Not confirmed. Check the site
- Platforms
- Web
- Open source
- Not stated
- Language
- English
- Last checked
- Oct 6, 2026 · Online when checked
- Listed
- Oct 5, 2026
Guides for Charts & Data Visualization
histogrammaker alternatives
Tools and sites you could use instead, ranked by how closely they match.

Line Graph Maker builds customizable line charts from labels and data values, with image export available from the page.

Pie Chart Maker creates customizable pie charts and lets users download them as JPG, PNG, or SVG files.
Free
24 alternatives
draw.io provides a free, open source application for creating diagrams, with storage options chosen by each team.

For custom data visualizations in JavaScript, D3.js provides tools for scales, axes, transitions, and DOM updates.

ParaView analyzes and visualizes data across settings ranging from laptops to supercomputers, according to its project site.

Plotly provides an open-source Python library for creating interactive charts and data visualizations.
Popular in Charts & Data Visualization
Well-known listings from the same topic.
Data GIF Makerdatagifmaker.withgoogle.comDatawrapperdatawrapper.deDataVizCataloguedatavizcatalogue.comaltairaltair-viz.github.ioCharts Buildercharts.hohli.comPlantUMLplantuml.com


histogrammaker FAQ
Can I import data from a spreadsheet?
The homepage says the tool accepts CSV and Excel files as data input.
What file formats can I download my histogram in?
Histograms can be downloaded as PNG, JPEG, or SVG files.
Do I have to set the bin size myself?
No. Bin size is calculated automatically by default, but custom intervals can be set instead.
Is something wrong or out of date?
Tell us and an editor will check it.
Own this website?
Claim this listing
Claim the listing and suggest updates yourself. An editor checks every claim first.