

plotly
Plotly provides an open-source Python library for creating interactive charts and data visualizations.
About plotly
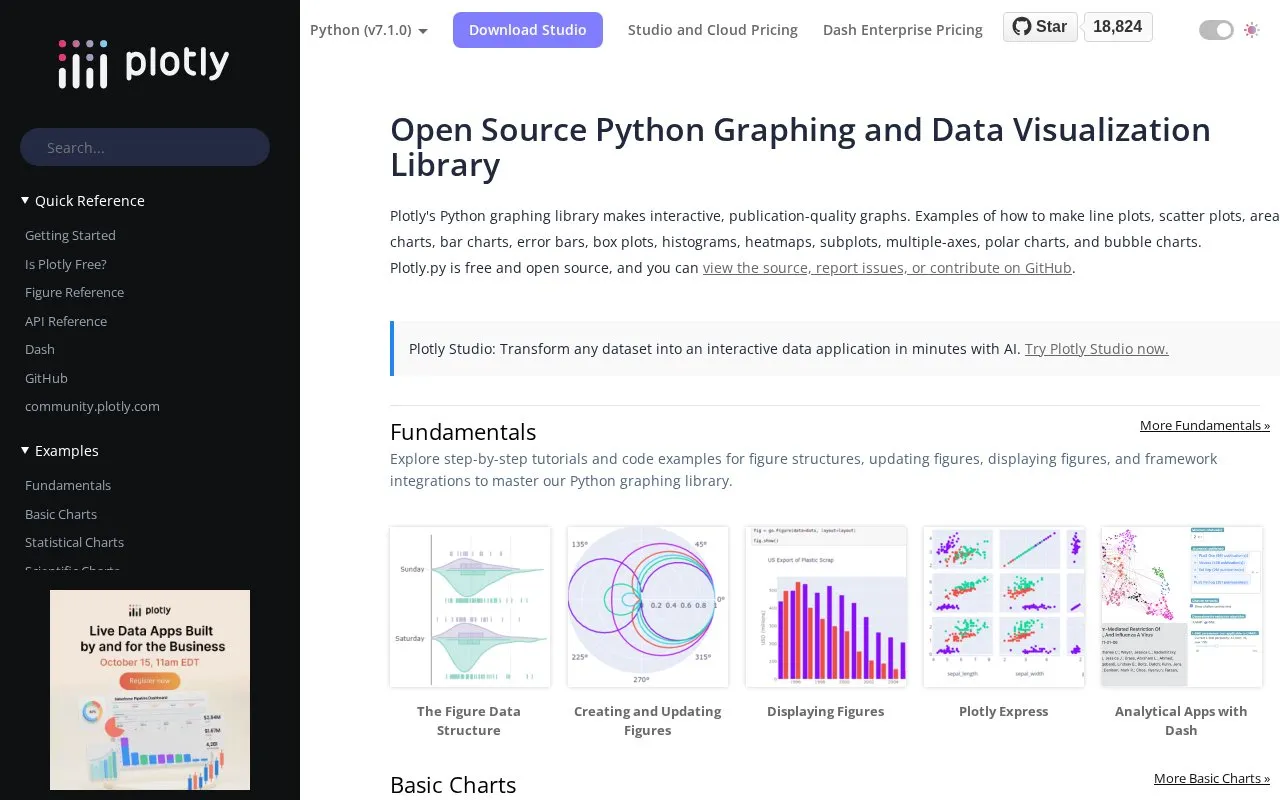
Plotly provides an open-source Python library for creating interactive charts and data visualizations for the web. The Python section of its website hosts documentation, step-by-step tutorials, and code examples for the library.
You can find copy-pasteable snippets and interactive demos for standard charts such as scatter plots, line graphs, bar charts, pie charts, and bubble charts, as well as statistical, financial, geographic, 3D, and scientific charts. Topics include figure structure, creating and updating figures, displaying figures, Plotly Express, subplots, animations, sliders and dropdowns, Jupyter FigureWidget integration, and analytical apps with Dash. Examples also cover heatmaps, histograms, candlestick charts, and map-based visualizations.
It suits Python users who work with data analysis and need to publish interactive graphs, including those covering finance, maps, machine learning, and bioinformatics.
Key features
- Interactive Python charts with copy-pasteable code snippets
- Tutorials for figure structure, updating and displaying figures
- Standard charts: scatter, line, bar, pie and bubble
- Statistical plots including histograms, box plots and error bars
- Maps, 3D plots, animations and Jupyter FigureWidget support
Best for: Python users who need to create interactive web-based charts for data analysis.
Good for
- Covers many chart types in one place
- Provides step-by-step tutorials with code examples
- Includes Jupyter and Dash integration guides
plotly at a glance
- Website
- plotly.com/python
- Category
- Design & Creative › Charts & Data Visualization
- Type
- Website
- Pricing
- Not confirmed. Check the site
- Platforms
- Web
- Open source
- Not stated
- Last checked
- Oct 5, 2026 · Online when checked
- Listed
- Oct 5, 2026
Guides for Charts & Data Visualization
plotly alternatives
Tools and sites you could use instead, ranked by how closely they match.

ipychart brings Chart.js plotting capabilities to Python and notebook workflows.
Open source
24 alternatives
For custom data visualizations in JavaScript, D3.js provides tools for scales, axes, transitions, and DOM updates.

Apache Superset is an open-source platform for data visualization and exploration.
Open source
24 alternatives
ParaView analyzes and visualizes data across settings ranging from laptops to supercomputers, according to its project site.

Histogram Maker creates customizable histograms from entered values or imported CSV and Excel data, with image download options.

Matplotlib provides Python tools for creating plots and visualizations from data.
Popular in Charts & Data Visualization
Well-known listings from the same topic.
Data GIF Makerdatagifmaker.withgoogle.comDatawrapperdatawrapper.deDataVizCataloguedatavizcatalogue.comLineGraphMakerlinegraphmaker.coaltairaltair-viz.github.ioCharts Buildercharts.hohli.com


plotly FAQ
What is Plotly for Python?
It is an open-source Python library for building interactive charts and graphs for the web, documented with tutorials and code examples.
What chart types does Plotly Python support?
Examples include scatter plots, line graphs, bar charts, pie charts, histograms, heatmaps, 3D plots, maps, and financial charts such as candlestick and OHLC.
Does Plotly Python work with Jupyter?
Yes, the site provides tutorials for using FigureWidget in Jupyter environments, including interactive analysis and click events.
Is something wrong or out of date?
Tell us and an editor will check it.
Own this website?
Claim this listing
Claim the listing and suggest updates yourself. An editor checks every claim first.