

bokeh
Bokeh creates interactive plots, dashboards, and data applications in Python.
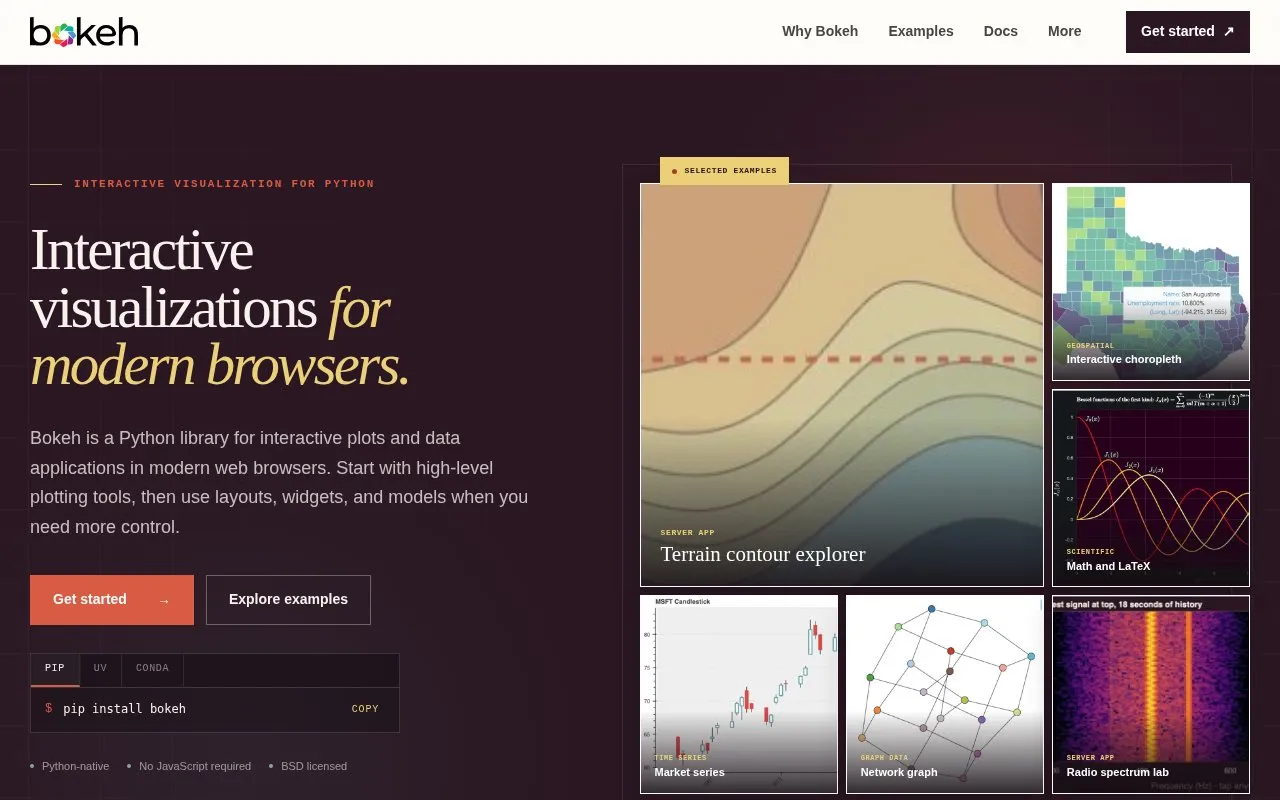
About bokeh
Bokeh is a Python library for creating interactive plots, dashboards and data applications that render in modern web browsers. It provides a high-level bokeh.plotting interface for building first charts, plus lower-level layouts, widgets, annotations, models, themes and extensions for custom applications. Plots include built-in tools for pan, zoom, hover, selection, linking, filtering and editable data, and supported glyphs can use WebGL acceleration. Data can be streamed or patched without replacing the full data source. Results can be shown in Jupyter notebooks and JupyterLab, saved as a standalone HTML file, embedded in an existing web page, run through the Bokeh server, or mounted in an ASGI application such as FastAPI, Starlette or Django and served with Uvicorn or Hypercorn.
Key features
- Built-in interaction tools for pan, zoom, hover, selection, linking and filtering
- High-level bokeh.plotting API plus layouts, widgets, annotations, models and themes
- Stream or patch data without replacing the full data source
- WebGL acceleration for supported glyphs
- Publish in notebooks, as standalone HTML, or embedded in pages
- Mount in ASGI apps like FastAPI, Starlette or Django without a separate process
Best for: Python users who need interactive charts and data applications for notebooks, web pages or browser-based dashboards.
Good for
- Python-native workflow that requires no JavaScript
- Several publishing options, including standalone HTML and embedding without a Python server
- BSD licensed, fiscally sponsored by NumFOCUS and maintained by contributors on GitHub
bokeh at a glance
- Website
- bokeh.org
- Category
- Design & Creative › Charts & Data Visualization
- Type
- Online tool
- Pricing
- Not confirmed. Check the site
- Platforms
- Web
- Open source
- Not stated
- Language
- English
- Last checked
- Oct 6, 2026 · Online when checked
- Listed
- Oct 5, 2026
Guides for Charts & Data Visualization
bokeh alternatives
Tools and sites you could use instead, ranked by how closely they match.

Matplotlib provides Python tools for creating plots and visualizations from data.

Plotly provides an open-source Python library for creating interactive charts and data visualizations.
pygal provides Python tools for creating charts and visualizing data in applications.

Vega-Altair provides declarative data visualization tools for Python applications.

Seaborn provides statistical data visualization tools and plotting functions for Python.

PyQtGraph provides Python graphics, data visualization, and GUI tools for scientific and engineering applications.
Popular in Charts & Data Visualization
Well-known listings from the same topic.
Data GIF Makerdatagifmaker.withgoogle.comDatawrapperdatawrapper.deDataVizCataloguedatavizcatalogue.comLineGraphMakerlinegraphmaker.coCharts Buildercharts.hohli.comPie Chart Makerpiechartmaker.co


bokeh FAQ
Do I need to write JavaScript to use Bokeh?
No. The homepage describes Bokeh as Python-native with no JavaScript required.
How can I publish a Bokeh plot?
Show it in a notebook, save a standalone HTML file, embed a component in an existing page, or run it with the Bokeh server. The standalone HTML and embedding options do not need a Python server.
Can Bokeh run inside an existing web framework?
Yes. It can be mounted in FastAPI, Starlette, Django or another ASGI app and served with Uvicorn or Hypercorn, without a separate Bokeh process.
Is something wrong or out of date?
Tell us and an editor will check it.
Own this website?
Claim this listing
Claim the listing and suggest updates yourself. An editor checks every claim first.