

Seaborn
Seaborn provides statistical data visualization tools and plotting functions for Python.
About Seaborn
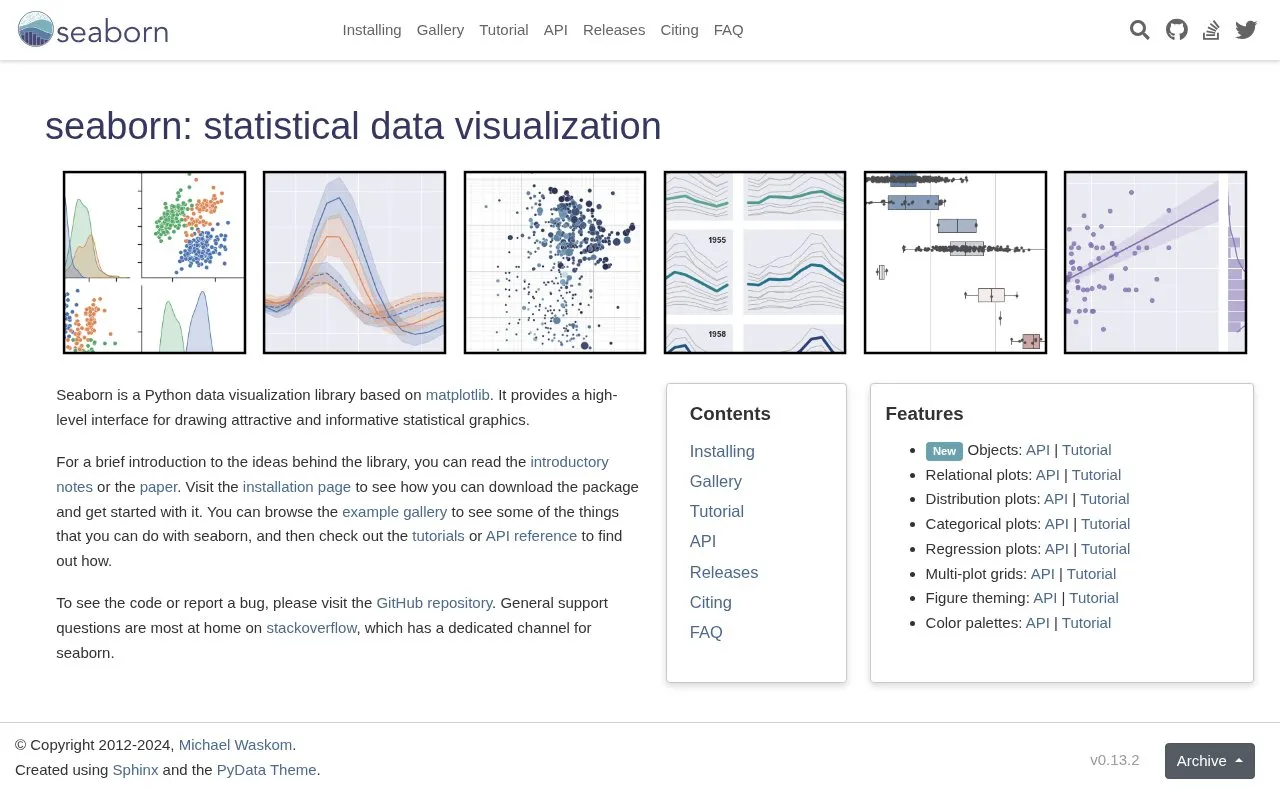
Seaborn is a Python library for statistical data visualization. It is built on matplotlib and provides a high-level interface for drawing statistical graphics. The homepage lists plot types for relational, distribution, categorical, and regression data, along with multi-plot grids, figure theming, and color palettes.
The homepage links to an installation page, an example gallery, tutorials, an API reference, and a GitHub repository for source code and bug reports. The source does not state licensing terms or pricing. The homepage lists version 0.13.2 of the documentation.
Key features
- New Objects API for building statistical plots
- Relational plots for showing relationships between variables
- Distribution plots for examining how data values are spread
- Categorical plots for comparing values across category groups
- Regression plots for fitting and displaying trends in data
- Multi-plot grids for arranging several related figures together
Best for: Python users who need statistical charts and already work with matplotlib.
Good for
- Built on matplotlib, the widely used Python plotting library
- Offers a high-level interface for statistical graphics
- Includes an example gallery, tutorials, and an API reference
Watch out for
- The source describes it as a Python library, so it is limited to Python use
Seaborn at a glance
- Website
- seaborn.pydata.org
- Category
- Design & Creative › Charts & Data Visualization
- Type
- Online tool
- Pricing
- Not confirmed. Check the site
- Platforms
- Web
- Open source
- Not stated
- Language
- English
- Last checked
- Oct 6, 2026 · Online when checked
- Listed
- Oct 5, 2026
Guides for Charts & Data Visualization
Seaborn alternatives
Tools and sites you could use instead, ranked by how closely they match.

Vega-Altair is a Python library for declarative statistical visualization.
Open source
24 alternatives
Vega-Altair provides declarative data visualization tools for Python applications.

Matplotlib provides Python tools for creating plots and visualizations from data.
pygal provides Python tools for creating charts and visualizing data in applications.

Bokeh creates interactive plots, dashboards, and data applications in Python.

Plotly provides an open-source Python library for creating interactive charts and data visualizations.
Popular in Charts & Data Visualization
Well-known listings from the same topic.
Data GIF Makerdatagifmaker.withgoogle.comDatawrapperdatawrapper.deDataVizCataloguedatavizcatalogue.comLineGraphMakerlinegraphmaker.coCharts Buildercharts.hohli.comPie Chart Makerpiechartmaker.co


Seaborn FAQ
Where can I find installation instructions?
The homepage links to an installation page that explains how to download the package and get started.
Where should I ask general support questions?
The homepage says general support questions are best directed to Stack Overflow, which has a dedicated channel for seaborn.
Where can I see the code or report a bug?
The homepage directs users to the GitHub repository for viewing the code and reporting bugs.
Is something wrong or out of date?
Tell us and an editor will check it.
Own this website?
Claim this listing
Claim the listing and suggest updates yourself. An editor checks every claim first.