

Datawrapper utilities (GitHub)
This Datawrapper repository contains shared JavaScript utility functions for client-side data visualization, released under the MIT license.
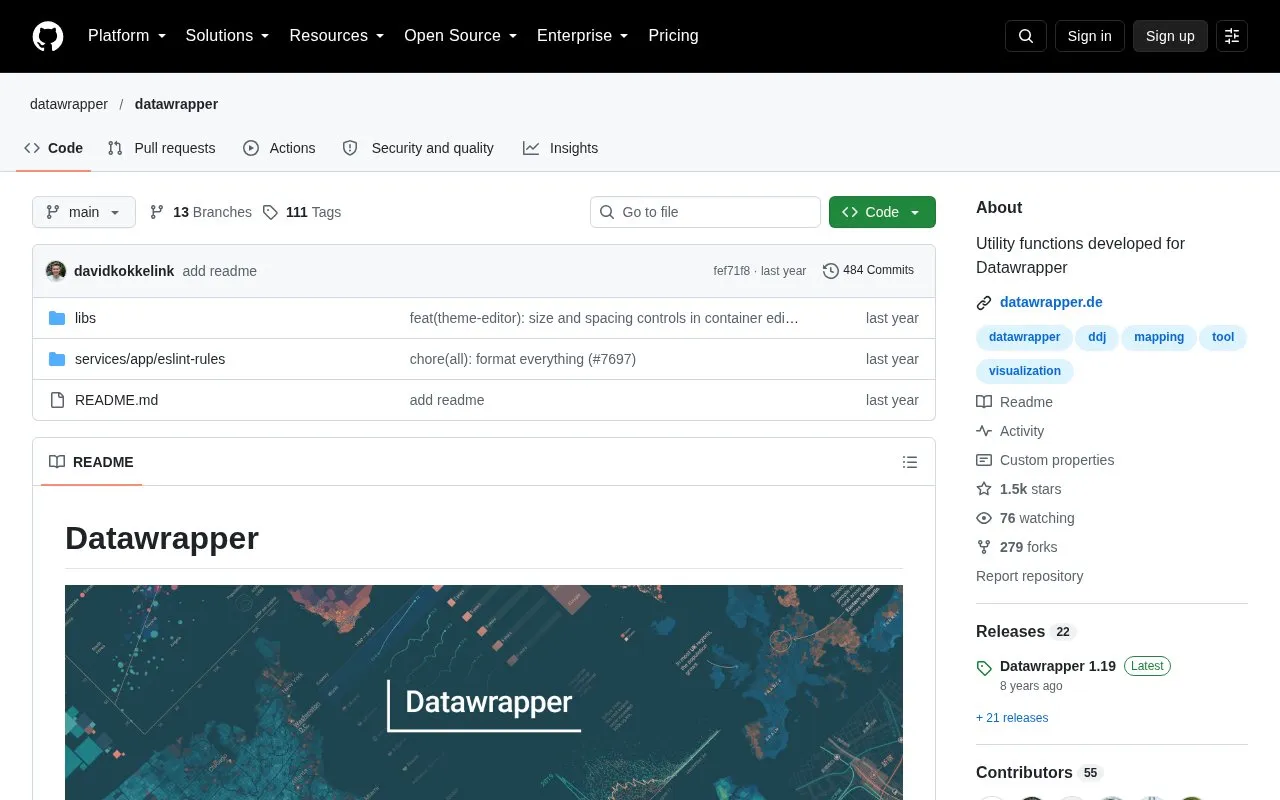
About Datawrapper utilities (GitHub)
This repository contains shared code developed for Datawrapper's client-side data visualizations. It includes JavaScript and TypeScript utilities that developers can inspect and integrate into their own code. The shared library documents individual function imports as well as a package import, with helpers for work such as formatting chart columns and measuring color lightness.
The code is MIT-licensed. The repository also contains an API reference for shared methods and documentation for parts of the chart core. It is most useful when you already have a JavaScript project and a specific function to evaluate. People who want to upload a spreadsheet and build a chart through a graphical editor should visit the separate Datawrapper application. That hosted service has its own features and pricing.
Key features
- Shared JavaScript and TypeScript utilities for client-side visualization.
- Individual-function and package imports for the shared library.
- Helpers for chart-column formatting and color-lightness calculations.
- Shared-method API documentation and chart-core references.
Best for: JavaScript and TypeScript developers evaluating reusable utilities for data visualization or Datawrapper-related work.
Good for
- MIT-licensed source is available to inspect and reuse.
- The shared library includes an API reference and import examples.
Watch out for
- Using the utilities requires development and integration work.
- The repository does not provide the hosted Datawrapper chart editor.
Datawrapper utilities (GitHub) at a glance
- Category
- Design & Creative › Charts & Data Visualization
- Type
- Open-source project
- Pricing
- Free
- Platforms
- Web
- Details verified
- Oct 20, 2026 · Official source
- Open source
- Yes · Source code
- Language
- English
- Last checked
- Oct 6, 2026 · Online when checked
- Listed
- Oct 5, 2026
Guides for Charts & Data Visualization
Datawrapper utilities (GitHub) alternatives
Tools and sites you could use instead, ranked by how closely they match.

The draw.io repository contains the JavaScript client-side editor for general diagramming and whiteboarding.
Open source
24 alternativesThe Data Visualisation Catalogue explains chart types and techniques, with a searchable library organized by visualization function.
Pick
24 alternatives
Seaborn provides statistical data visualization tools and plotting functions for Python.

For custom data visualizations in JavaScript, D3.js provides tools for scales, axes, transitions, and DOM updates.

More than 50 chart types and modules are available in ZingChart, a JavaScript library for data visualization projects.

Datawrapper creates interactive charts, maps, and tables in a web app without requiring code, according to its site.
Pick
24 alternativesPopular in Charts & Data Visualization
Well-known listings from the same topic.
Data GIF Makerdatagifmaker.withgoogle.comLineGraphMakerlinegraphmaker.coaltairaltair-viz.github.ioCharts Buildercharts.hohli.comPie Chart Makerpiechartmaker.coPlantUMLplantuml.com


Datawrapper utilities (GitHub) FAQ
Does downloading this repository give me Datawrapper's hosted chart editor?
No. This repository publishes shared utility code. The graphical chart, map and table service is a separate Datawrapper product.
Are the utility functions documented?
The shared library has an API reference and import examples. There are also source examples and documentation for parts of chart-core.
Is something wrong or out of date?
Tell us and an editor will check it.
Own this website?
Claim this listing
Claim the listing and suggest updates yourself. An editor checks every claim first.