

ZingChart
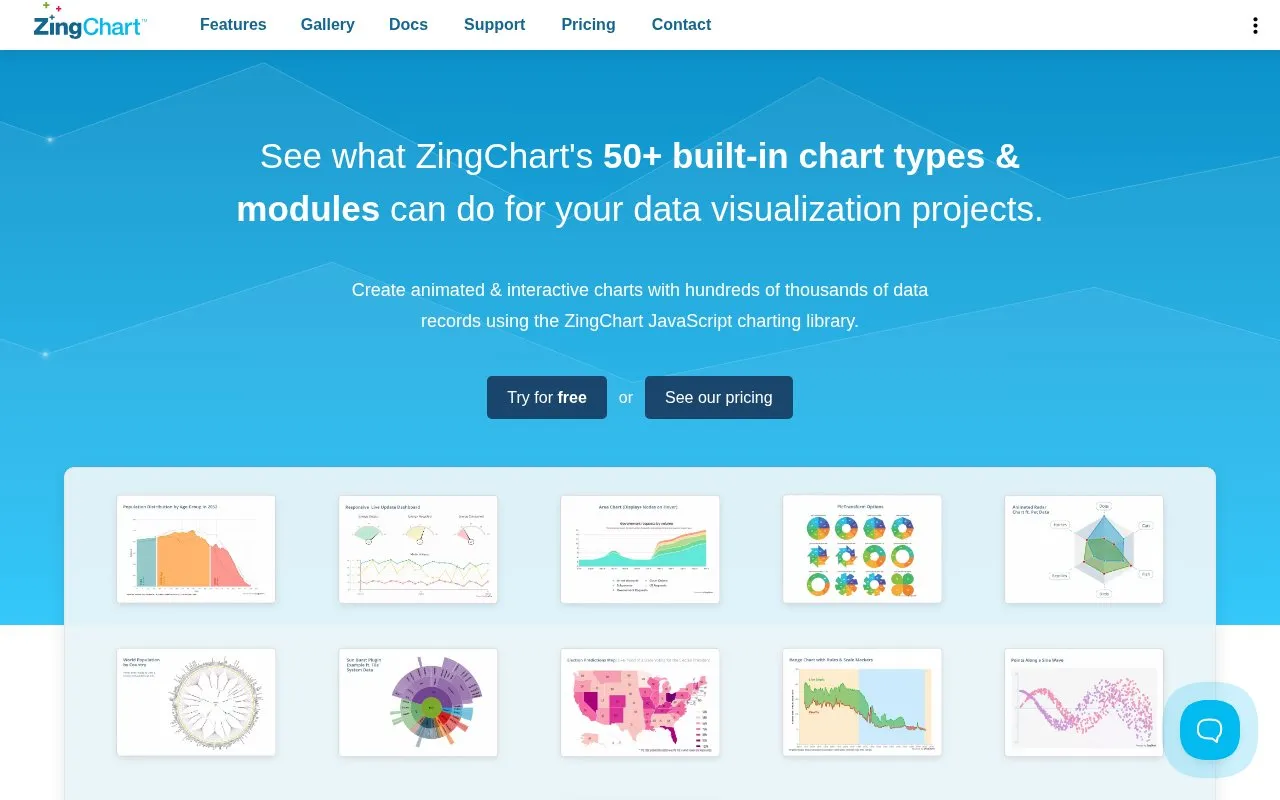
More than 50 chart types and modules are available in ZingChart, a JavaScript library for data visualization projects.
About ZingChart
ZingChart is a JavaScript library for data visualization that uses JSON configuration to define charts. It includes 50+ built-in chart types and modules, such as bar, line, pie, maps, gauge and treemaps, with animation, interactivity and drill-down features.
The library is dependency-free and can be installed via NPM or loaded via CDN. It provides API events and methods for modifying charts with custom code, and wrappers for React, Angular, Vue and Web Component. The source describes optimization for data sets ranging from 10,000 to 100,000 records.
Key features
- 50+ built-in chart types including bar, line, pie, maps and gauges
- JSON-based chart configuration rendered with zingchart.render
- Animated and interactive charts with drill-down features
- API events and methods to modify charts with custom code
- Dependency-free JavaScript library installable via NPM or CDN
- Wrappers for React, Angular, Vue and Web Component
Best for: Developers building web applications that need configurable JavaScript charts.
Good for
- Includes 50+ built-in chart types and modules
- Dependency-free with NPM and CDN installation
- Offers wrappers for React, Angular, Vue and Web Component
ZingChart at a glance
- Website
- zingchart.com
- Category
- Design & Creative › Charts & Data Visualization
- Type
- Online tool
- Pricing
- Not confirmed. Check the site
- Platforms
- Web
- Open source
- Not stated
- Language
- English
- Good for
- Developers
- Last checked
- Oct 5, 2026 · Online when checked
- Listed
- Oct 5, 2026
Guides for Charts & Data Visualization
ZingChart alternatives
Tools and sites you could use instead, ranked by how closely they match.

amCharts provides JavaScript charting components, maps, stock charts, and Gantt charts.

Use AnyChart, a JavaScript charting library, with its chart types and API documentation.
The Data Visualisation Catalogue explains chart types and techniques, with a searchable library organized by visualization function.
Pick
24 alternatives
For custom data visualizations in JavaScript, D3.js provides tools for scales, axes, transitions, and DOM updates.

Highcharts provides JavaScript charting for dashboards, maps, stock data, grids, and web applications.

Interactive charts for multidimensional datasets can be built with dc.js, a JavaScript library that supports Crossfilter.
Popular in Charts & Data Visualization
Well-known listings from the same topic.
Data GIF Makerdatagifmaker.withgoogle.comDatawrapperdatawrapper.deLineGraphMakerlinegraphmaker.coaltairaltair-viz.github.ioCharts Buildercharts.hohli.comPie Chart Makerpiechartmaker.co


ZingChart FAQ
How do I add a basic chart to a page?
Include the library via CDN or NPM, add a div wrapper, then call zingchart.render with an id and JSON data configuration.
Which frameworks does ZingChart support?
It provides installable wrappers for React, Angular, Vue, and Web Component.
How are charts configured?
Charts use JSON configuration specifying type and series values.
Is something wrong or out of date?
Tell us and an editor will check it.
Own this website?
Claim this listing
Claim the listing and suggest updates yourself. An editor checks every claim first.