

D3.js
For custom data visualizations in JavaScript, D3.js provides tools for scales, axes, transitions, and DOM updates.
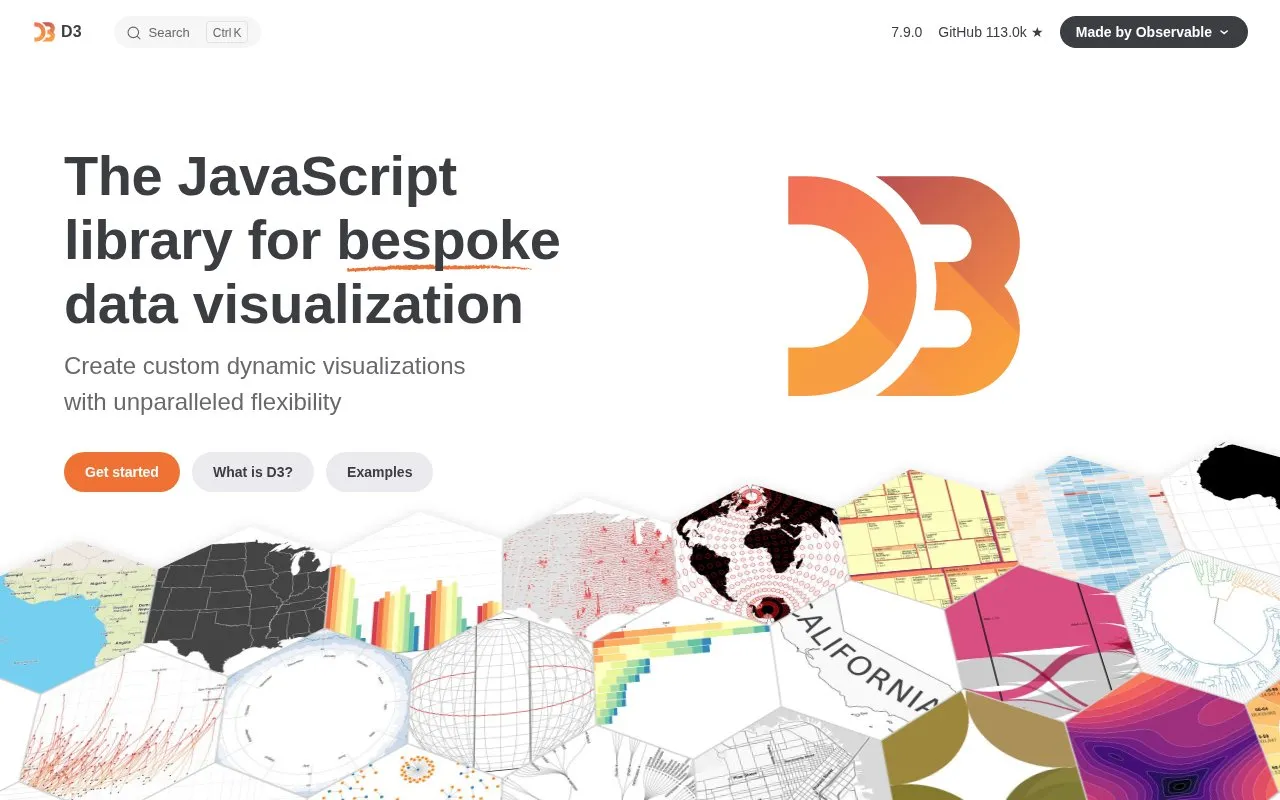
About D3.js
D3.js is a JavaScript library for creating custom dynamic data visualizations. It provides tools for creating, updating and animating DOM elements based on data, encoding data with scales and axes, rendering geometric shapes, and adding interactions such as panning, zooming, brushing and dragging.
It also includes layout algorithms for treemaps, trees, force-directed graphs and other structures, geographic projections with clipping, and utilities for CSV parsing, date parsing and formatting, color, and statistics. The D3 team also builds Observable Plot, a high-level API for quick charts built on top of D3.
Key features
- Create, update and animate DOM elements based on data
- Encode data with scales and explain positions with axes
- Render shapes such as arcs, lines, pies, stacks and symbols
- Add panning, zooming, brushing and dragging interactions
- Apply layouts including treemaps, trees and force-directed graphs
- Create geographic maps with spherical projections and clipping
Best for: Developers building custom data visualizations in JavaScript.
Good for
- Covers DOM updates, scales, shapes, interactions, layouts and maps
- Includes utilities for CSV parsing, date formatting and statistics
- Serves as the foundation for Observable Plot for higher-level charts
D3.js at a glance
- Website
- d3js.org
- Category
- Design & Creative › Charts & Data Visualization
- Type
- Online tool
- Pricing
- Not confirmed. Check the site
- Platforms
- Web
- Open source
- Not stated
- Language
- English
- Last checked
- Oct 5, 2026 · Online when checked
- Listed
- Oct 5, 2026
Guides for Charts & Data Visualization
D3.js alternatives
Tools and sites you could use instead, ranked by how closely they match.

ParaView analyzes and visualizes data across settings ranging from laptops to supercomputers, according to its project site.

Histogram Maker creates customizable histograms from entered values or imported CSV and Excel data, with image download options.

Plotly provides an open-source Python library for creating interactive charts and data visualizations.

Apache Superset is an open-source platform for data visualization and exploration.
Open source
24 alternatives
Lux automatically visualizes Pandas DataFrames to support data exploration.
Open source
24 alternatives
ipychart brings Chart.js plotting capabilities to Python and notebook workflows.
Open source
24 alternativesPopular in Charts & Data Visualization
Well-known listings from the same topic.
Data GIF Makerdatagifmaker.withgoogle.comDatawrapperdatawrapper.deDataVizCataloguedatavizcatalogue.comLineGraphMakerlinegraphmaker.coaltairaltair-viz.github.ioCharts Buildercharts.hohli.com


D3.js FAQ
What is D3?
It is a JavaScript library for bespoke, custom dynamic data visualization.
What is Observable Plot in relation to D3?
It is a high-level API for quick charts built on top of D3 by the D3 team.
Is something wrong or out of date?
Tell us and an editor will check it.
Own this website?
Claim this listing
Claim the listing and suggest updates yourself. An editor checks every claim first.