

ipychart
ipychart brings Chart.js plotting capabilities to Python and notebook workflows.
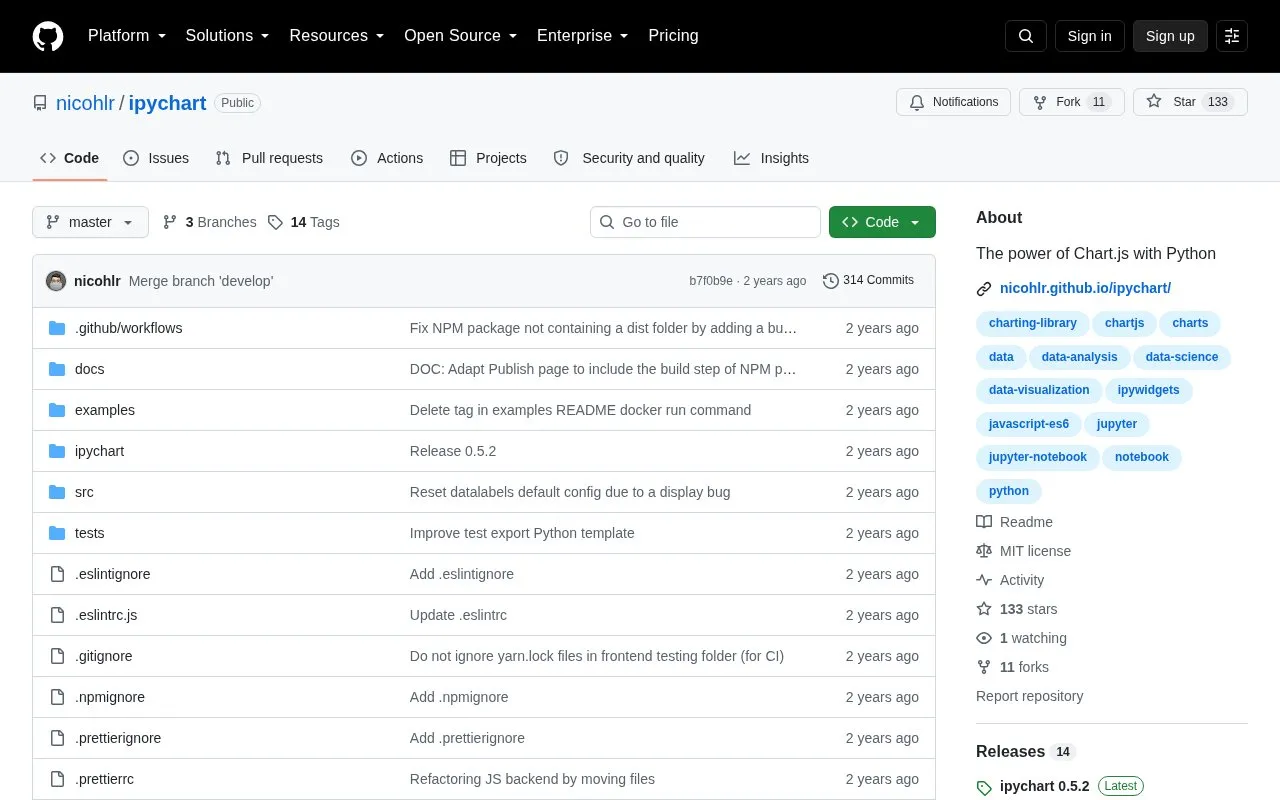
About ipychart
ipychart is a Python package that creates Chart.js charts inside Jupyter notebook environments. Charts are defined in Python in a similar way to Chart.js and are shown in cell output as interactive, configurable and modular charts.
It can also generate charts directly from a pandas dataframe. It installs with pip or conda and is available under the MIT license.
Key features
- Create Chart.js-style charts using Python code
- Show interactive charts in Jupyter notebook cell output
- Generate charts directly from a pandas dataframe
- Use Chart.js-like configuration and scales
- Install via pip or conda-forge
Best for: Best for Python users who work in Jupyter notebooks and need Chart.js charts.
Good for
- Open source under the MIT license
- Installable with pip or conda
- Supports chart creation from pandas dataframes
ipychart at a glance
- Website
- github.com/nicohlr/ipychart
- Category
- Design & Creative › Charts & Data Visualization
- Type
- Open-source project
- Pricing
- Not confirmed. Check the site
- Open source
- Yes · Source code
- Language
- English
- Last checked
- Oct 6, 2026 · Online when checked
- Listed
- Oct 5, 2026
Guides for Charts & Data Visualization
ipychart alternatives
Tools and sites you could use instead, ranked by how closely they match.

Apache Superset is an open-source platform for data visualization and exploration.
Open source
24 alternatives
Lux automatically visualizes Pandas DataFrames to support data exploration.
Open source
24 alternatives
teeplot organizes visualization output and names files based on semantic plotting variables.
Open source
24 alternatives
Plotly provides an open-source Python library for creating interactive charts and data visualizations.

For custom data visualizations in JavaScript, D3.js provides tools for scales, axes, transitions, and DOM updates.

ParaView analyzes and visualizes data across settings ranging from laptops to supercomputers, according to its project site.
Popular in Charts & Data Visualization
Well-known listings from the same topic.
Data GIF Makerdatagifmaker.withgoogle.comDatawrapperdatawrapper.deDataVizCataloguedatavizcatalogue.comLineGraphMakerlinegraphmaker.coaltairaltair-viz.github.ioCharts Buildercharts.hohli.com


ipychart FAQ
How do I install ipychart?
Use pip install ipychart or conda install -c conda-forge ipychart from a terminal.
Can I make charts from a pandas dataframe?
Yes, charts can be created directly from a pandas dataframe.
Where do charts appear?
Charts are displayed directly in the output of Jupyter notebook cells.
Is something wrong or out of date?
Tell us and an editor will check it.
Own this website?
Claim this listing
Claim the listing and suggest updates yourself. An editor checks every claim first.