

Hanami
Hanami provides interactive plotting and charting with ClojureScript and Vega.
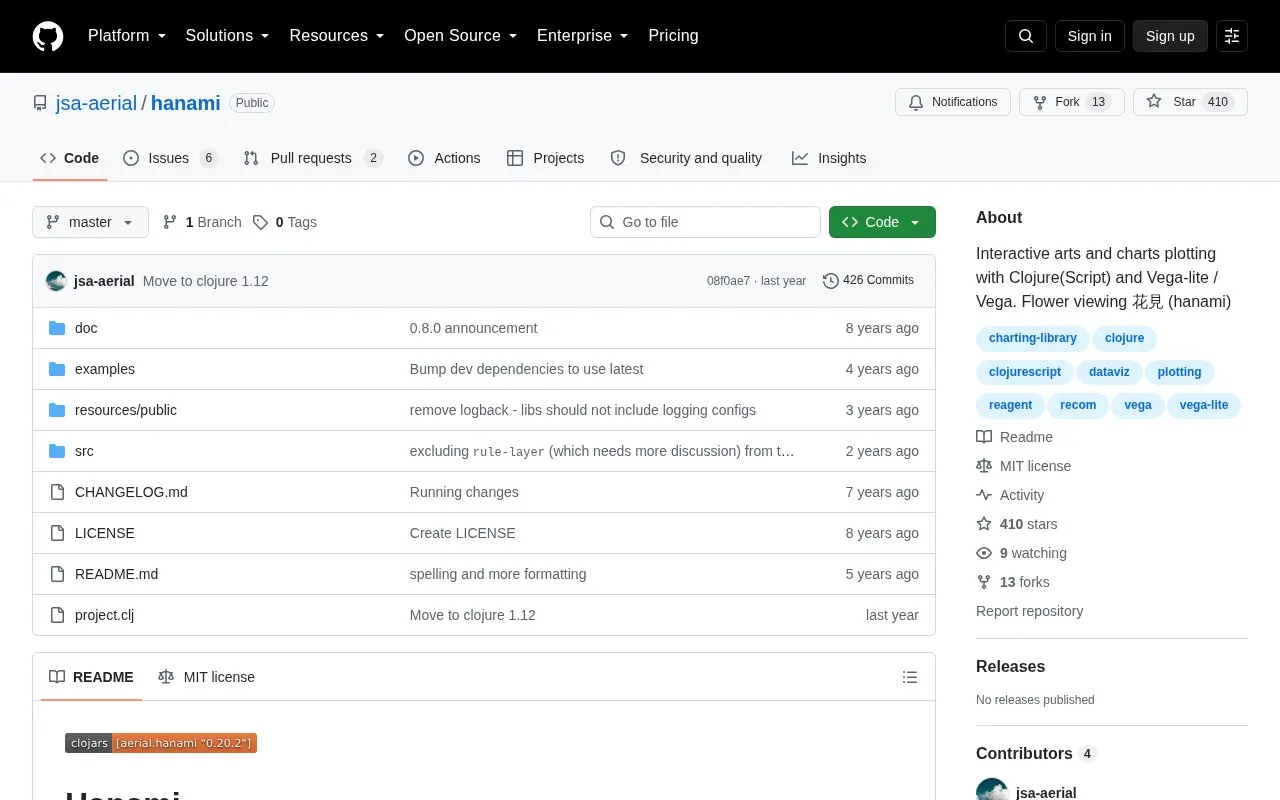
About Hanami
Hanami is a Clojure(Script) library and framework for building interactive visualization applications. It creates charts and plots from Vega-Lite and Vega specifications, which are declarative and defined entirely by data as JSON maps. Vega-Lite compiles into Vega, which compiles to a runtime that uses lower-level environments such as D3, HTML5 Canvas, and WebGL. Hanami is built on Reagent and Re-Com.
Instead of a conventional API for generating specifications, Hanami uses parameterized templates with recursive transformations. Templates can be composed, merged, and shared as libraries of reusable plots and visualizations. Hanami itself includes only a small set of very generic templates, so domain- or task-specific templates are expected to be built by users or other libraries.
Key features
- Creates interactive visualizations from Vega-Lite and Vega declarative specifications
- Parameterized templates with recursive transformations
- User-definable templates with their own defaults
- Tabbing system for named visualization groupings
- Multiple simultaneous independent or dependent visualizations per grouping
- Automatic grid layout and an option system for customization
Best for: Developers who work in Clojure or ClojureScript and want to build interactive charts and visualization applications from reusable templates.
Good for
- Specifications are declarative JSON maps, defined entirely by data
- Templates can be shared as reusable libraries of plots and visualizations
- Open source, with the source code hosted on GitHub
Watch out for
- Hanami itself provides only a small set of very generic templates
Hanami at a glance
- Website
- github.com/jsa-aerial/hanami
- Category
- Design & Creative › Charts & Data Visualization
- Type
- Open-source project
- Pricing
- Not confirmed. Check the site
- Open source
- Yes · Source code
- Language
- English
- Last checked
- Oct 6, 2026 · Online when checked
- Listed
- Oct 5, 2026
Guides for Charts & Data Visualization
Hanami alternatives
Tools and sites you could use instead, ranked by how closely they match.

ipychart brings Chart.js plotting capabilities to Python and notebook workflows.
Open source
24 alternatives
Vega-Altair is a Python library for declarative statistical visualization.
Open source
24 alternatives
family-chart is a D3-based library for visualizing interactive family trees, with examples and additional features documented in its repository.
Open source
24 alternatives
The bqplot project provides plotting tools for IPython and Jupyter notebook environments.
Open source
24 alternatives
teeplot organizes visualization output and names files based on semantic plotting variables.
Open source
24 alternatives
The glot package provides plotting functions for Go programs using gnuplot.
Open source
24 alternativesPopular in Charts & Data Visualization
Well-known listings from the same topic.
Data GIF Makerdatagifmaker.withgoogle.comDatawrapperdatawrapper.deDataVizCataloguedatavizcatalogue.comLineGraphMakerlinegraphmaker.coaltairaltair-viz.github.ioCharts Buildercharts.hohli.com


Hanami FAQ
How do I add Hanami to a project?
Add [aerial.hanami "0.15.1"] to the :dependencies of your project.
What technologies is Hanami built on?
Hanami is built on Vega-Lite and Vega specifications, and on Reagent and Re-Com.
Is something wrong or out of date?
Tell us and an editor will check it.
Own this website?
Claim this listing
Claim the listing and suggest updates yourself. An editor checks every claim first.