

globe
The globe library creates wireframe visualizations of a sphere using Go code.
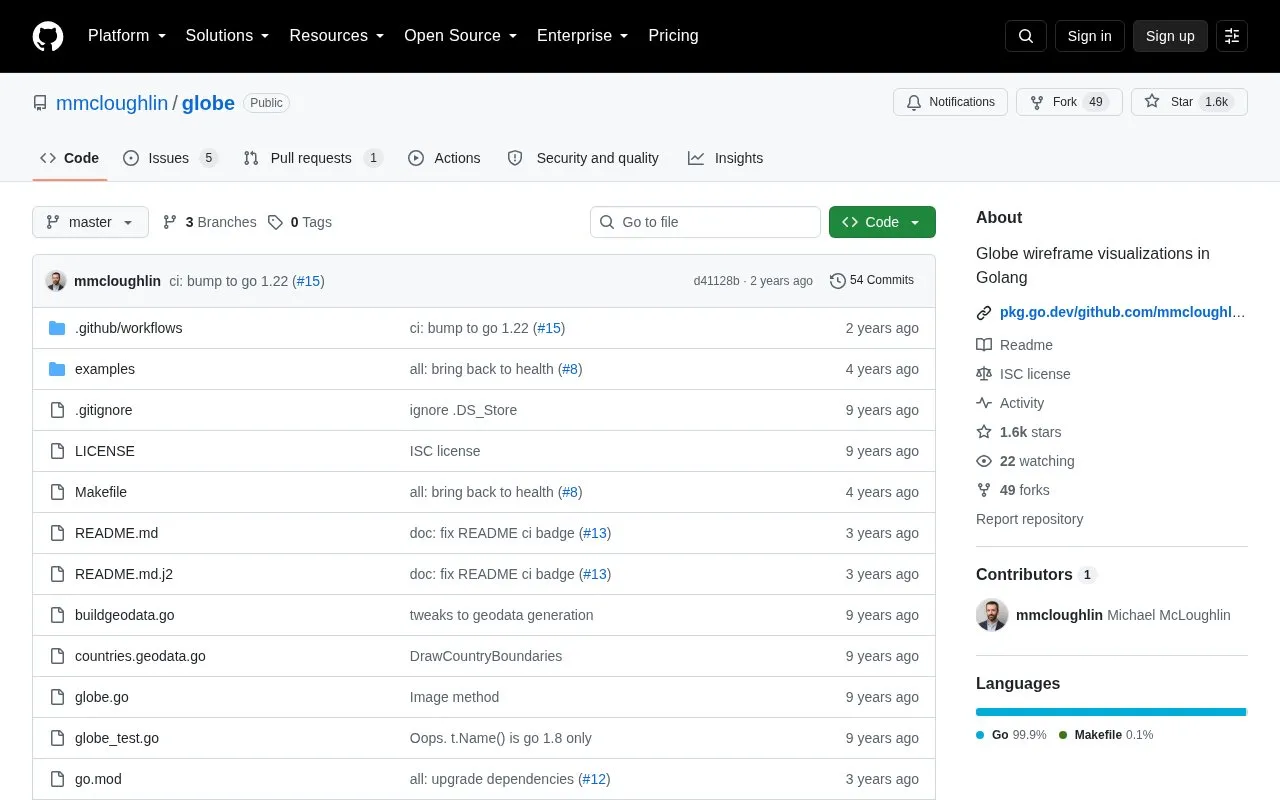
About globe
globe is a Go library for wireframe visualizations of a sphere, backed by pinhole. It is installed with go get and used in Go code to generate globe images saved as PNG files.
Pricing is not clearly stated.
Key features
- Draw graticule at specified degree intervals
- Draw land boundaries or country boundaries
- Center view on latitude-longitude coordinates
- Plot dots at latitude-longitude points
- Draw lines along great circles
- Draw rectangles from coordinate pairs
globe at a glance
- Website
- github.com/mmcloughlin/globe
- Category
- Design & Creative › Charts & Data Visualization
- Type
- Open-source project
- Pricing
- Not confirmed. Check the site
- Details verified
- Oct 22, 2026 · Official source
- Open source
- Yes · Source code
- Language
- English
- Last checked
- Oct 5, 2026 · Online when checked
- Listed
- Oct 5, 2026
Guides for Charts & Data Visualization
globe alternatives
Tools and sites you could use instead, ranked by how closely they match.

Vega-Altair is a Python library for declarative statistical visualization.
Open source
24 alternatives
JSON Crack is an open source visualization application that turns JSON, YAML, XML, and CSV data into interactive graphs.
Open source
24 alternatives
RAWGraphs App provides a web interface for creating custom vector-based visualizations with the RAWGraphs core.
Open source
24 alternatives
torchvista visualizes a PyTorch model’s forward pass in notebooks and can export the visualization as an image, SVG, or HTML.
Open source
24 alternatives
Apache Superset is an open-source platform for data visualization and exploration.
Open source
24 alternatives
teeplot organizes visualization output and names files based on semantic plotting variables.
Open source
24 alternativesPopular in Charts & Data Visualization
Well-known listings from the same topic.
Data GIF Makerdatagifmaker.withgoogle.comDatawrapperdatawrapper.deDataVizCataloguedatavizcatalogue.comLineGraphMakerlinegraphmaker.coaltairaltair-viz.github.ioCharts Buildercharts.hohli.com


Is something wrong or out of date?
Tell us and an editor will check it.
Own this website?
Claim this listing
Claim the listing and suggest updates yourself. An editor checks every claim first.