

Superset
Apache Superset is an open-source platform for data visualization and exploration.
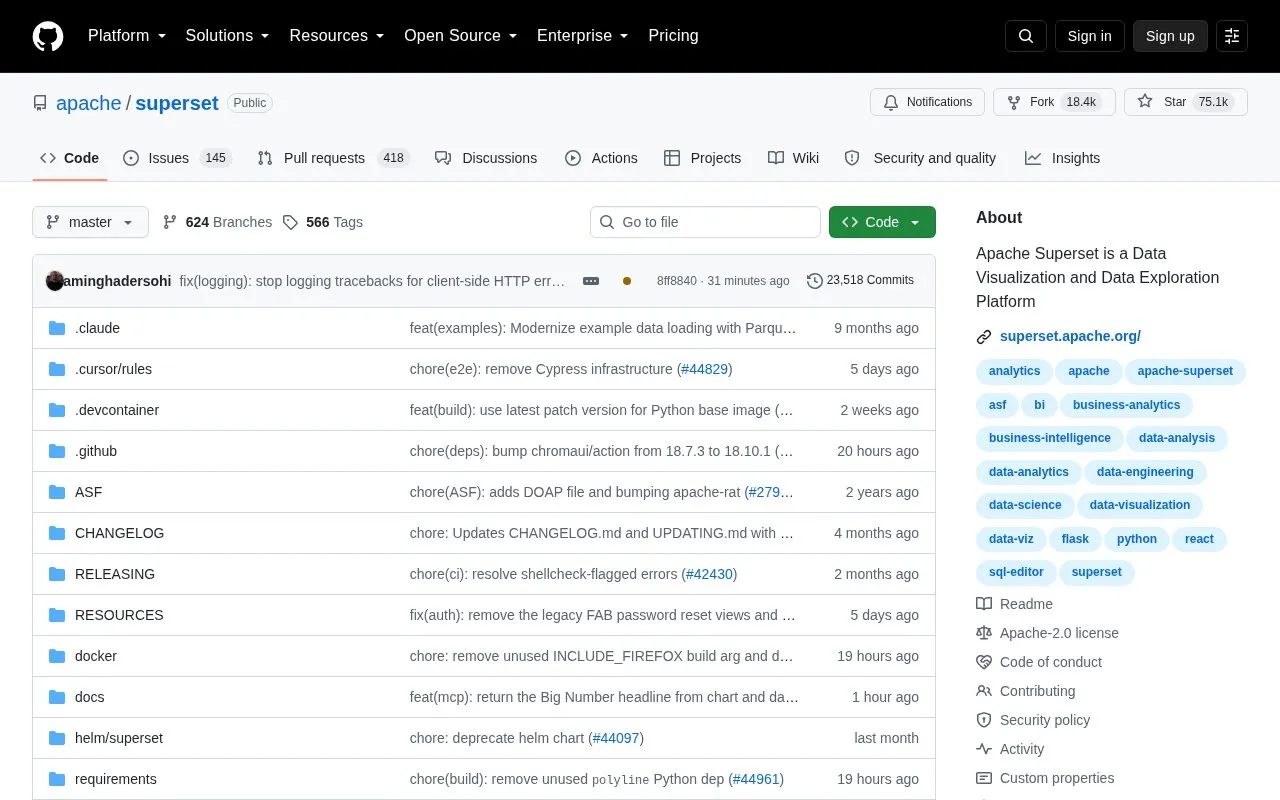
About Superset
Superset is an open-source business intelligence web application for data exploration and visualization, distributed through its Apache GitHub repository. It provides a no-code interface for building charts, a web-based SQL editor for advanced querying, and a lightweight semantic layer for defining custom dimensions and metrics. It can query any SQL-speaking datastore or data engine that has a Python DB-API driver and a SQLAlchemy dialect, and it includes a configurable caching layer, extensible security roles and authentication options, and an API for programmatic customization. The project is self-hosted and the repository supplies installation and production deployment guidance; no pricing information is stated in the source.
Key features
- No-code interface for building charts from connected data
- Web-based SQL Editor for advanced querying
- Lightweight semantic layer for custom dimensions and metrics
- Visualizations from simple bar charts to geospatial maps
- Configurable caching layer to ease database load
- API for programmatic customization and extension
Best for: Teams willing to self-host an open-source BI platform for exploring SQL data and building charts and dashboards.
Good for
- Open-source project hosted and maintained under the Apache repository
- Works with any SQL datastore or engine having a Python DB-API driver and SQLAlchemy dialect
- Extensible security roles, authentication options and an API for customization
Watch out for
- Data sources must have a Python DB-API driver and a SQLAlchemy dialect to be queried
- Self-hosted, so installation and production deployment setup fall to the user
- No pricing information is provided in the source
Superset at a glance
- Category
- Design & Creative › Charts & Data Visualization
- Type
- Open-source project
- Pricing
- Not confirmed. Check the site
- Open source
- Yes · Source code
- Language
- English
- Last checked
- Oct 6, 2026 · Online when checked
- Listed
- Oct 5, 2026
Guides for Charts & Data Visualization
Superset alternatives
Tools and sites you could use instead, ranked by how closely they match.

Lux automatically visualizes Pandas DataFrames to support data exploration.
Open source
24 alternatives
ipychart brings Chart.js plotting capabilities to Python and notebook workflows.
Open source
24 alternatives
teeplot organizes visualization output and names files based on semantic plotting variables.
Open source
24 alternatives
Plotly provides an open-source Python library for creating interactive charts and data visualizations.

For custom data visualizations in JavaScript, D3.js provides tools for scales, axes, transitions, and DOM updates.

ParaView analyzes and visualizes data across settings ranging from laptops to supercomputers, according to its project site.
Popular in Charts & Data Visualization
Well-known listings from the same topic.
Data GIF Makerdatagifmaker.withgoogle.comDatawrapperdatawrapper.deDataVizCataloguedatavizcatalogue.comLineGraphMakerlinegraphmaker.coaltairaltair-viz.github.ioCharts Buildercharts.hohli.com


Superset FAQ
What databases can Superset query?
Any SQL-speaking datastore or data engine that has a Python DB-API driver and a SQLAlchemy dialect, such as Presto, Trino and Athena.
Do I need to write code to build charts?
Charts can be built through a no-code interface, while a web-based SQL Editor is available for advanced querying.
Can Superset be customized programmatically?
Yes, it offers an API for programmatic customization along with an extension framework.
Is something wrong or out of date?
Tell us and an editor will check it.
Own this website?
Claim this listing
Claim the listing and suggest updates yourself. An editor checks every claim first.