

teeplot
teeplot organizes visualization output and names files based on semantic plotting variables.
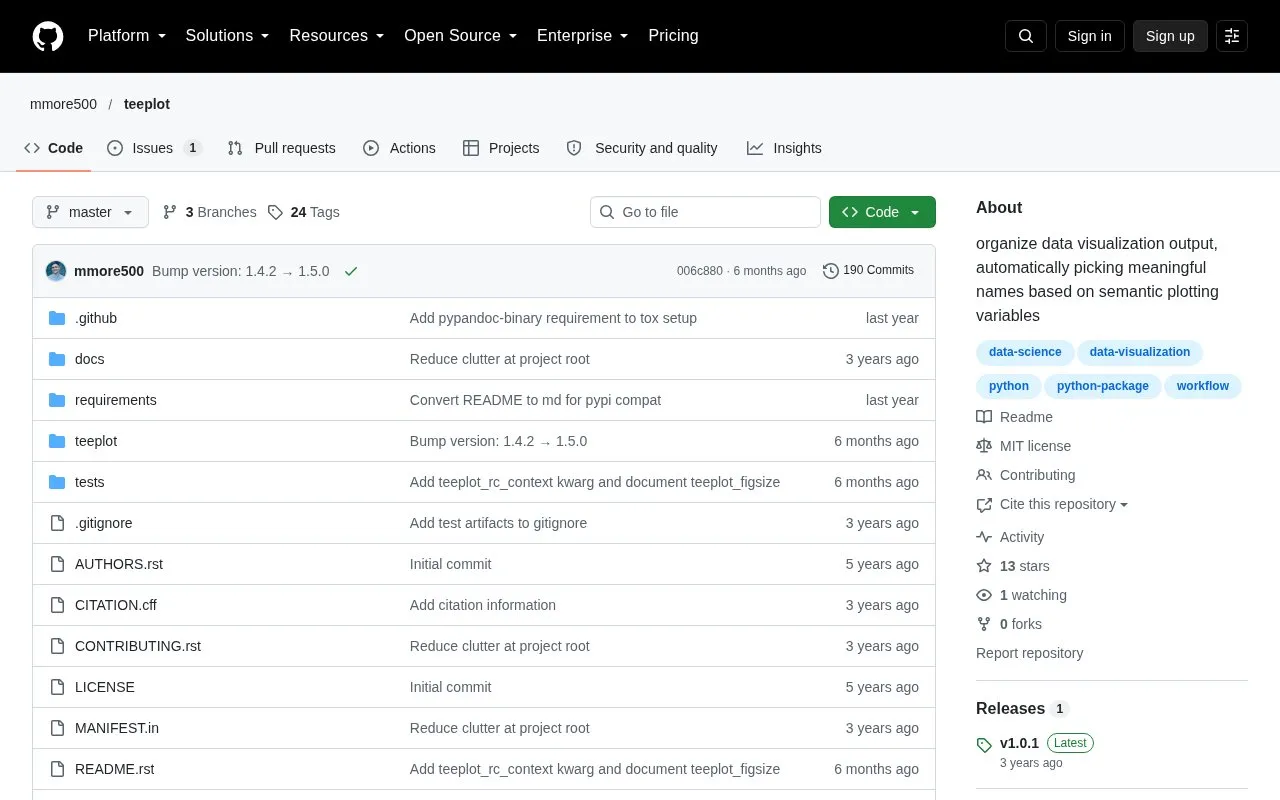
About teeplot
teeplot is an open source Python utility that organizes data visualization output by automatically generating meaningful filenames based on semantic plotting variables. It eliminates the need for manual file management when saving plots generated with common Python plotting libraries. The tool works by wrapping existing plotting function calls to handle matplotlib file output, extracting key parameter details to create systematic, descriptive file names. It includes optional features such as a global draftmode flag to disable file output entirely, a teed context manager interface, and a callback parameter to delay plot saving so users can adjust figures before finalizing output.
Key features
- Wraps plotting calls to automate matplotlib file output handling
- Generates descriptive filenames from semantic plotting variables
- Compatible with pandas, seaborn, and matplotlib plotting functions
- Includes global draftmode flag to disable all file output
- Supports delayed plot saving for pre-save figure adjustments
- Allows module-level configuration of default output formats
Best for: Data scientists and analysts working in Python who regularly generate and organize data visualizations, particularly in notebook environments.
Good for
- Automates manual file naming and organization for visualization outputs
- Works with widely used Python plotting libraries including pandas, seaborn, and matplotlib
- Provides flexible workflow options for different plotting needs
teeplot at a glance
- Website
- github.com/mmore500/teeplot
- Category
- Design & Creative › Charts & Data Visualization
- Type
- Open-source project
- Pricing
- Not confirmed. Check the site
- Open source
- Yes · Source code
- Language
- English
- Last checked
- Oct 6, 2026 · Online when checked
- Listed
- Oct 5, 2026
Guides for Charts & Data Visualization
teeplot alternatives
Tools and sites you could use instead, ranked by how closely they match.

ipychart brings Chart.js plotting capabilities to Python and notebook workflows.
Open source
24 alternatives
Apache Superset is an open-source platform for data visualization and exploration.
Open source
24 alternatives
Lux automatically visualizes Pandas DataFrames to support data exploration.
Open source
24 alternatives
Vega-Altair is a Python library for declarative statistical visualization.
Open source
24 alternatives
SolidUI generates graphs from a sentence, according to its repository description.
Open source
24 alternatives
Seaborn provides statistical data visualization tools and plotting functions for Python.
Popular in Charts & Data Visualization
Well-known listings from the same topic.
Data GIF Makerdatagifmaker.withgoogle.comDatawrapperdatawrapper.deDataVizCataloguedatavizcatalogue.comLineGraphMakerlinegraphmaker.coaltairaltair-viz.github.ioCharts Buildercharts.hohli.com


teeplot FAQ
How does teeplot generate filenames for saved plots?
It extracts key information from plotting function parameters and arguments to create descriptive, systematic filenames.
Can teeplot be used with common Python plotting libraries?
Yes, it supports plotting functions from pandas, seaborn, and matplotlib.
Is there a way to disable automatic file output?
Yes, the global draftmode flag can be used to disable all file output.
Is something wrong or out of date?
Tell us and an editor will check it.
Own this website?
Claim this listing
Claim the listing and suggest updates yourself. An editor checks every claim first.