

PyQtGraph
PyQtGraph provides Python graphics, data visualization, and GUI tools for scientific and engineering applications.
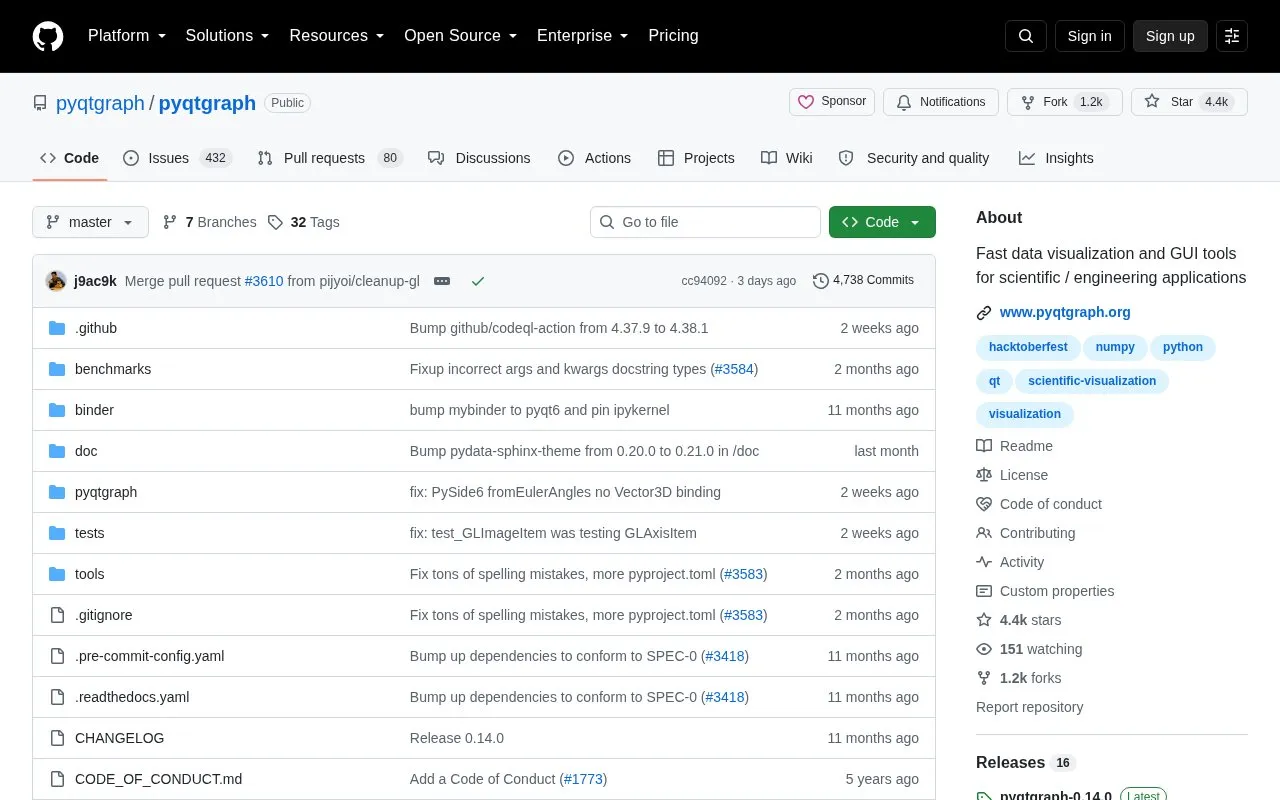
About PyQtGraph
PyQtGraph is a pure-Python graphics library built on the Qt framework, intended for mathematics, scientific, and engineering applications. It delivers fast performance by leveraging NumPy for number crunching, Qt's GraphicsView framework for 2D display, and OpenGL for 3D display. The library supports Python 3.12+, Qt 5.15 or 6.8+, and compatible Qt bindings including PyQt5, PyQt6, and PySide6. Optional third-party dependencies can add functionality such as image processing, HDF5 export, perceptually uniform colormaps, and Jupyter Notebook support.
Key features
- Pure-Python graphics library built on the Qt framework
- Fast 2D data visualization using Qt GraphicsView
- 3D display support via OpenGL integration
- NumPy-powered computation for high performance
- Optional image processing with SciPy, CuPy, or Numba
- HDF5 export support via optional h5py dependency
Best for: It is best suited for Python developers building scientific, engineering, or mathematics applications that require fast, customizable data visualization and GUI tools.
Good for
- Written entirely in Python for accessibility
- Uses NumPy, Qt, and OpenGL for fast performance
- Supports multiple common Qt bindings
Watch out for
- Requires Python 3.12 or newer
- Only supports Qt 5.15+ or Qt 6.8+
- Extra functionality depends on third-party libraries
PyQtGraph at a glance
- Category
- Design & Creative › Charts & Data Visualization
- Type
- Open-source project
- Pricing
- Not confirmed. Check the site
- Open source
- Not stated
- Language
- English
- Last checked
- Oct 6, 2026 · Online when checked
- Listed
- Oct 5, 2026
Guides for Charts & Data Visualization
PyQtGraph alternatives
Tools and sites you could use instead, ranked by how closely they match.

Vega-Altair is a Python library for declarative statistical visualization.
Open source
24 alternatives
Plotly provides an open-source Python library for creating interactive charts and data visualizations.

Vega-Altair provides declarative data visualization tools for Python applications.

Matplotlib provides Python tools for creating plots and visualizations from data.

Seaborn provides statistical data visualization tools and plotting functions for Python.
pygal provides Python tools for creating charts and visualizing data in applications.
Popular in Charts & Data Visualization
Well-known listings from the same topic.
Data GIF Makerdatagifmaker.withgoogle.comDatawrapperdatawrapper.deDataVizCataloguedatavizcatalogue.comLineGraphMakerlinegraphmaker.coCharts Buildercharts.hohli.comPie Chart Makerpiechartmaker.co


PyQtGraph FAQ
What Python versions does PyQtGraph support?
Python versions released within the last 3 years, currently Python 3.12 or newer.
What Qt bindings are compatible with PyQtGraph?
PyQt5, PyQt6, and PySide6 are supported.
How can I add extra features to PyQtGraph?
Optional third-party libraries like SciPy, h5py, and CuPy add functionality such as image processing and HDF5 export.
Is something wrong or out of date?
Tell us and an editor will check it.
Own this website?
Claim this listing
Claim the listing and suggest updates yourself. An editor checks every claim first.