
pygal
pygal provides Python tools for creating charts and visualizing data in applications.
About pygal
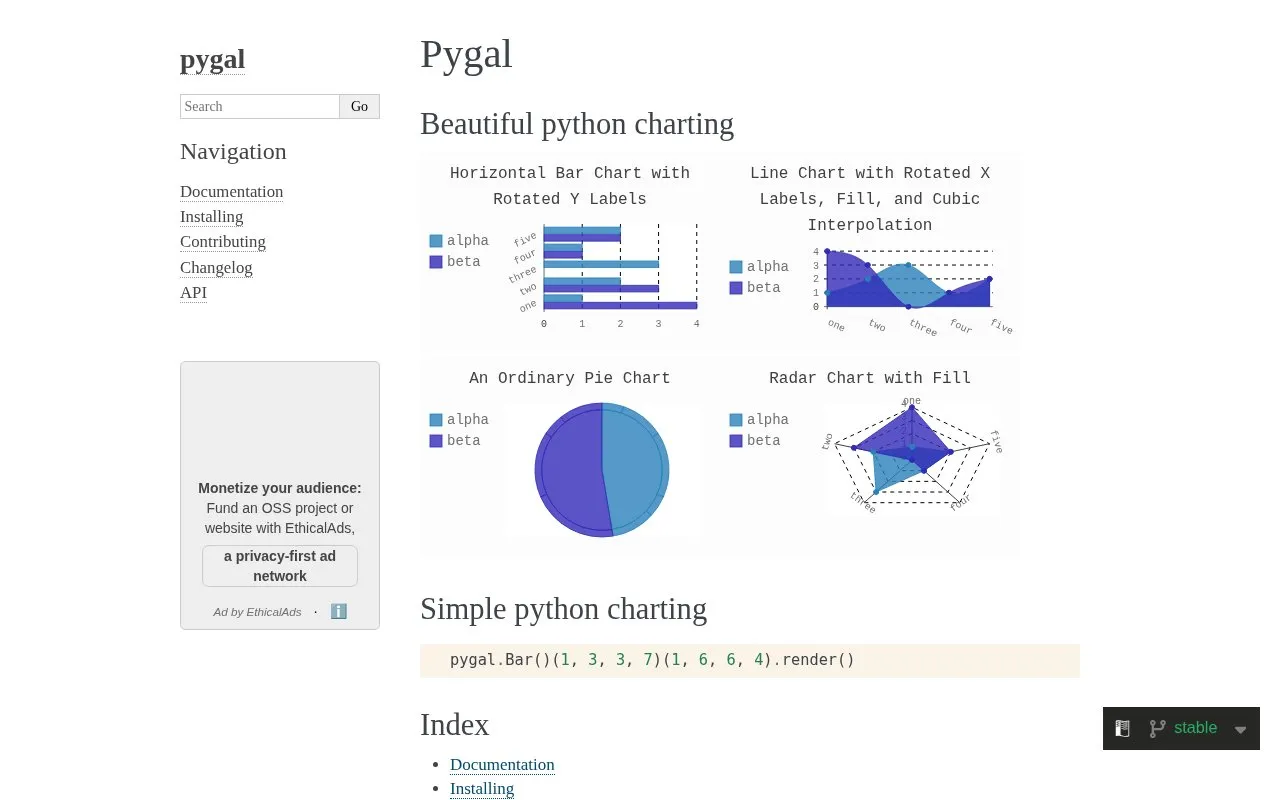
Pygal is a Python tool for creating charts and visualizing data in applications. The site hosts the documentation for pygal 3.0.5 and presents Python charting through short code examples. One example shows building a bar chart with pygal.Bar() and calling render to produce output.
The documentation site includes pages for installing, contributing, changelog, and API reference. Visitors can also use an index, module index, and search page to find topics. The pages identify Pygal as a Kozea project and provide navigation for the documentation overview.
It suits Python developers and others working with data visualization who use Python in web or application projects. Readers should be comfortable reading code and API documentation to install the package and create charts. Content is in English.
Key features
- Create bar charts with Python code
- Render chart output from applications
- Browse API reference documentation
- Follow installing and contributing guides
- Use index and search to find topics
Best for: Python developers who need to create charts in applications using code.
Good for
- Includes API reference and installing guides
- Shows code example for bar charts
- Provides search, index, and module index
Watch out for
- Requires Python knowledge to use
pygal at a glance
- Website
- pygal.org/en/stable
- Category
- Design & Creative › Charts & Data Visualization
- Type
- Online tool
- Pricing
- Not confirmed. Check the site
- Platforms
- Web
- Open source
- Not stated
- Language
- English
- Last checked
- Oct 5, 2026 · Online when checked
- Listed
- Oct 5, 2026
Guides for Charts & Data Visualization
pygal alternatives
Tools and sites you could use instead, ranked by how closely they match.

Matplotlib provides Python tools for creating plots and visualizations from data.

Plotly provides an open-source Python library for creating interactive charts and data visualizations.

Vega-Altair provides declarative data visualization tools for Python applications.

Seaborn provides statistical data visualization tools and plotting functions for Python.

Bokeh creates interactive plots, dashboards, and data applications in Python.

QuickChart generates chart images through an API that can embed visualizations in emails, reports, and other platforms.
Popular in Charts & Data Visualization
Well-known listings from the same topic.
Data GIF Makerdatagifmaker.withgoogle.comDatawrapperdatawrapper.deDataVizCataloguedatavizcatalogue.comLineGraphMakerlinegraphmaker.coCharts Buildercharts.hohli.comPie Chart Makerpiechartmaker.co


pygal FAQ
What is Pygal used for?
Pygal provides Python tools for creating charts and visualizing data in applications.
What documentation does the Pygal site provide?
The site includes installing information, API reference, changelog, index, module index, and search.
Does Pygal show code examples?
Yes, the homepage shows a bar chart example using pygal.Bar() with render().
Is something wrong or out of date?
Tell us and an editor will check it.
Own this website?
Claim this listing
Claim the listing and suggest updates yourself. An editor checks every claim first.