

raw
RAWGraphs is a free, open-source tool for creating data visualizations.
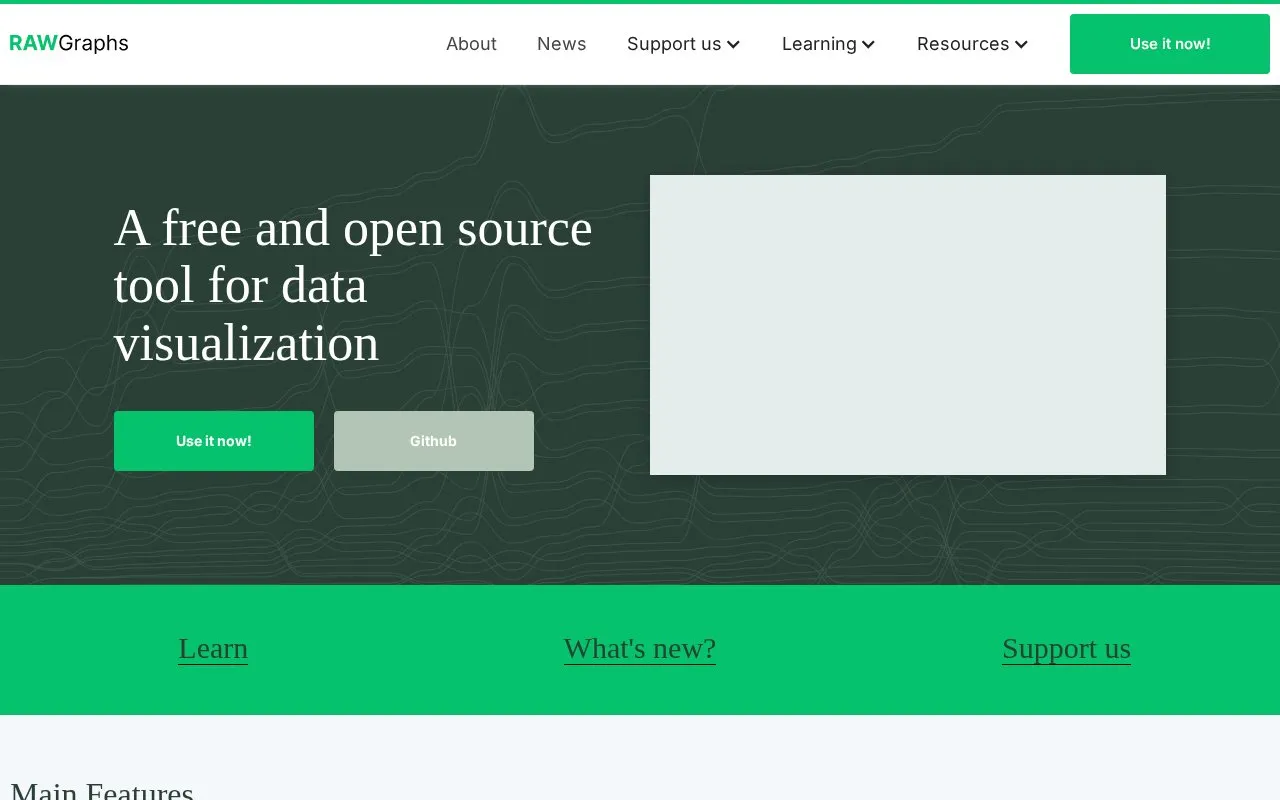
About raw
RAWGraphs is a web tool for creating data visualizations. It offers almost 30 visual models for quantities, hierarchies and time series, with options to save projects and export charts as vector or raster images for editing in other software. It states that inserted data is processed only by the user's web browser, while the website uses Google Analytics to anonymously collect browsing data.
Key features
- Almost 30 visual models for quantities, hierarchies, and time series
- Data inserted is processed only by the user's web browser
- Save projects for later use
- Export charts as vector or raster images
- Edit exported files in external software
- Open to community contributions
Best for: People who need to make charts from quantities, hierarchies, or time series data.
Good for
- Inserted data is stated to be processed only by the user's web browser
- Offers almost 30 visual models for different data types
- Allows saving projects and exporting as vector or raster images
Watch out for
- Website uses Google Analytics to anonymously collect browsing data
raw at a glance
- Website
- rawgraphs.io
- Category
- Design & Creative › Charts & Data Visualization
- Type
- Online tool
- Pricing
- Not confirmed. Check the site
- Platforms
- Web
- Open source
- Not stated
- Last checked
- Oct 5, 2026 · Online when checked
- Listed
- Oct 5, 2026
Guides for Charts & Data Visualization
raw alternatives
Tools and sites you could use instead, ranked by how closely they match.

RAWGraphs App provides a web interface for creating custom vector-based visualizations with the RAWGraphs core.
Open source
24 alternatives
Matplotlib provides Python tools for creating plots and visualizations from data.
pygal provides Python tools for creating charts and visualizing data in applications.

Plotly provides an open-source Python library for creating interactive charts and data visualizations.
Edotor provides a web-based editor for creating and editing Graphviz diagrams.

draw.io provides a free, open source application for creating diagrams, with storage options chosen by each team.
Popular in Charts & Data Visualization
Well-known listings from the same topic.
Data GIF Makerdatagifmaker.withgoogle.comDatawrapperdatawrapper.deDataVizCataloguedatavizcatalogue.comLineGraphMakerlinegraphmaker.coaltairaltair-viz.github.ioCharts Buildercharts.hohli.com


Is something wrong or out of date?
Tell us and an editor will check it.
Own this website?
Claim this listing
Claim the listing and suggest updates yourself. An editor checks every claim first.