

matplotlib
Matplotlib provides Python tools for creating plots and visualizations from data.
About matplotlib
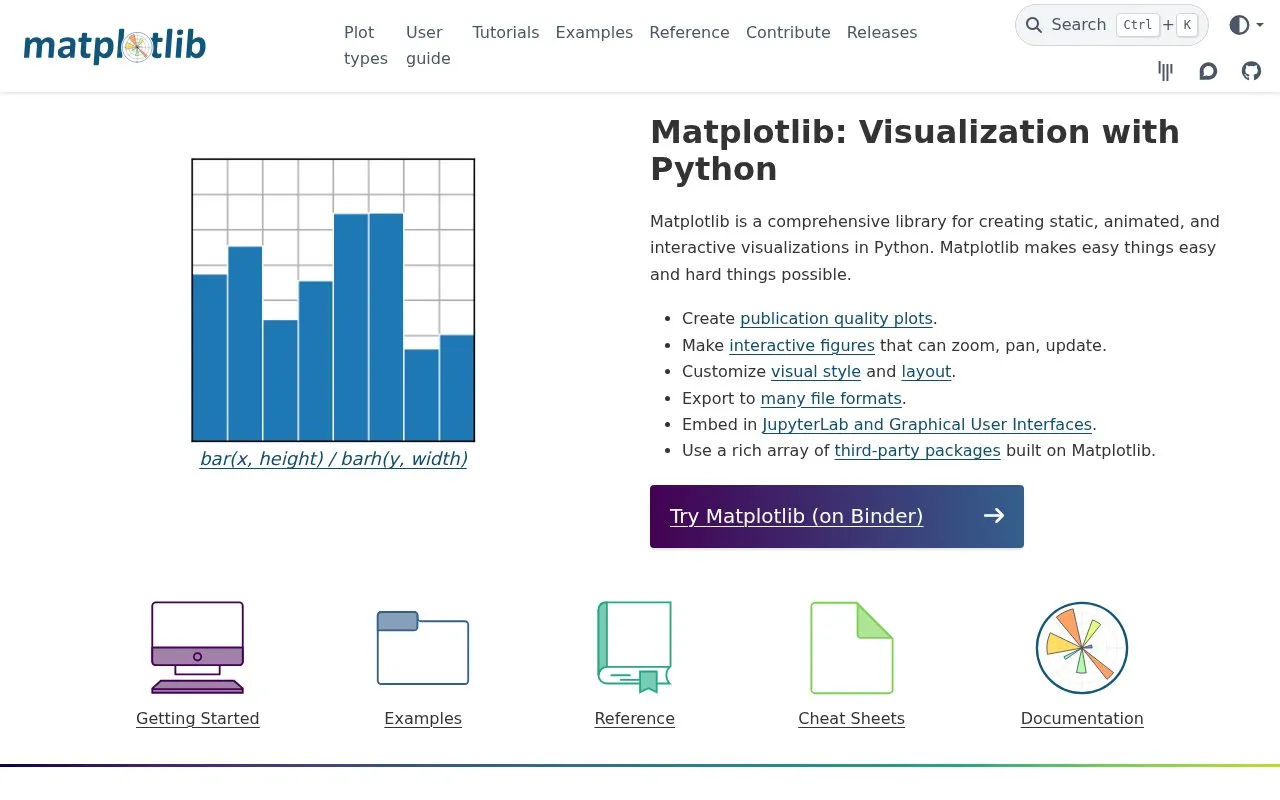
Matplotlib is a Python library for creating static, animated, and interactive visualizations from data. It is used to build publication-quality plots and figures that can be customized and exported to many file formats. It can also be embedded in JupyterLab and graphical user interfaces.
The library is a code-based tool rather than a standalone application, so creating charts requires writing Python. Third-party packages such as seaborn, Cartopy, and plotnine build on Matplotlib for statistical, geospatial, and grammar-of-graphics plotting. Pricing is not stated on the homepage.
Key features
- Static, animated, and interactive visualizations created in Python
- Interactive figures that can be zoomed, panned, and updated
- Customization of visual style and layout
- Export to many file formats
- Embedding in JupyterLab and graphical user interfaces
- Third-party packages built on Matplotlib, such as seaborn and Cartopy
Best for: Python users such as data analysts, scientists, and researchers who need to produce plots from their own data.
Good for
- Documentation includes a user guide, API reference, and full-text searchable examples.
- Community help is available through a Discourse forum, a Matplotlib tag on StackOverflow, and monthly contributor calls.
- Third-party packages extend it for statistical graphics, maps, and other specialized plots.
Watch out for
- Use requires Python, since the homepage describes it as a Python library.
matplotlib at a glance
- Website
- matplotlib.org
- Category
- Design & Creative › Charts & Data Visualization
- Type
- Online tool
- Pricing
- Not confirmed. Check the site
- Platforms
- Web
- Open source
- Not stated
- Language
- English
- Last checked
- Oct 6, 2026 · Online when checked
- Listed
- Oct 5, 2026
Guides for Charts & Data Visualization
matplotlib alternatives
Tools and sites you could use instead, ranked by how closely they match.

Bokeh creates interactive plots, dashboards, and data applications in Python.
pygal provides Python tools for creating charts and visualizing data in applications.

Plotly provides an open-source Python library for creating interactive charts and data visualizations.

Vega-Altair provides declarative data visualization tools for Python applications.

Seaborn provides statistical data visualization tools and plotting functions for Python.

PyQtGraph provides Python graphics, data visualization, and GUI tools for scientific and engineering applications.
Popular in Charts & Data Visualization
Well-known listings from the same topic.
Data GIF Makerdatagifmaker.withgoogle.comDatawrapperdatawrapper.deDataVizCataloguedatavizcatalogue.comLineGraphMakerlinegraphmaker.coCharts Buildercharts.hohli.comPie Chart Makerpiechartmaker.co


matplotlib FAQ
Where can I get help with Matplotlib?
The homepage recommends the Discourse forum at discourse.matplotlib.org, and the Matplotlib tag on StackOverflow. The project also holds a monthly call for new contributors.
Can I try Matplotlib without installing it?
The homepage links to a 'Try Matplotlib' option that runs on Binder.
How can I support the project financially?
Support is available by sponsoring Matplotlib on GitHub or by making a USA tax-deductible donation through NumFOCUS.
Is something wrong or out of date?
Tell us and an editor will check it.
Own this website?
Claim this listing
Claim the listing and suggest updates yourself. An editor checks every claim first.