
DataVizCatalogue
The Data Visualisation Catalogue explains chart types and techniques, with a searchable library organized by visualization function.
About DataVizCatalogue
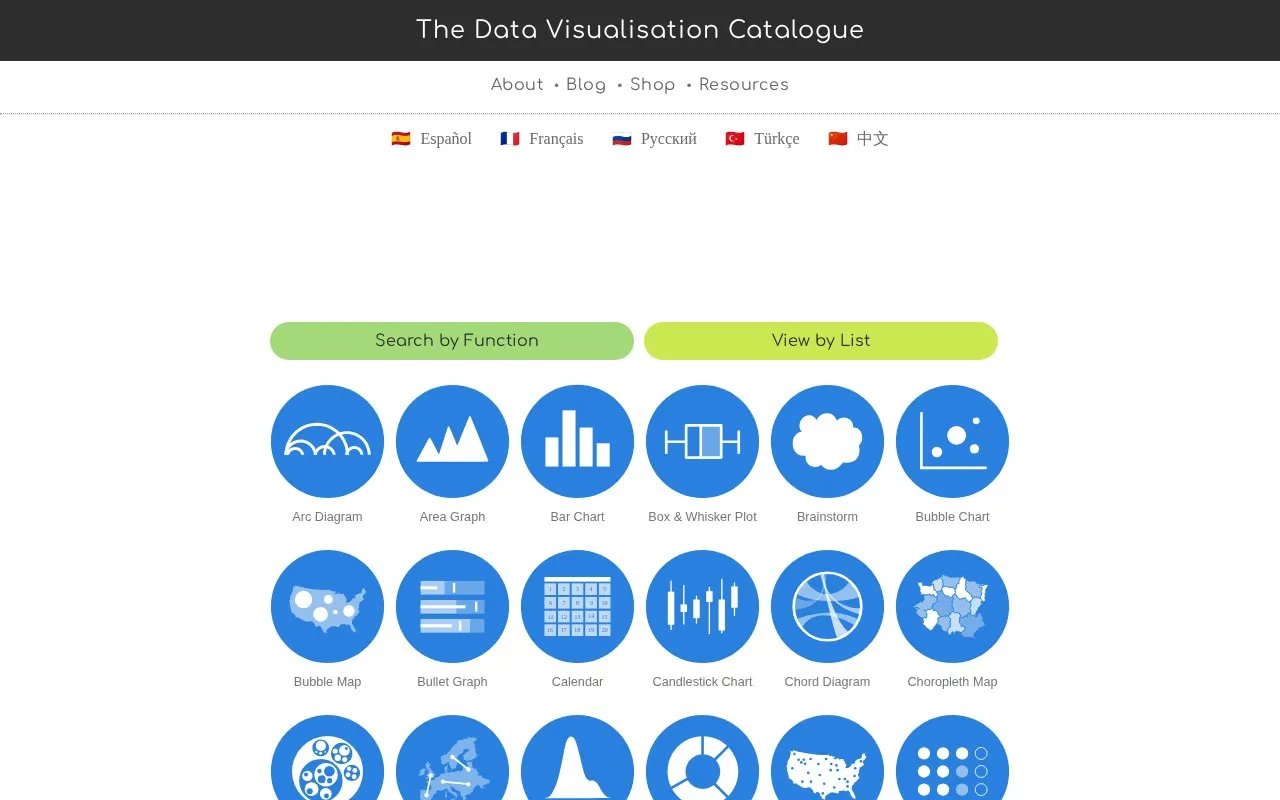
The Data Visualisation Catalogue is a web-based guide and library focused on data visualization techniques. It explains different chart types and methods and serves as a learning resource for data visualization.
Visitors can browse entries by visualization function or view them as a list. Search by Function helps users find options based on what they want to show with data. The catalogue includes types such as bar charts, pie charts, line graphs, heatmaps, treemaps, Sankey diagrams, and many others. The site also has About, Blog, Shop, and Resources sections, and offers visualization icons.
It suits students, designers, writers, and others who work with data and need to understand or select a chart type. The site is in English and is accessed through a web browser.
Key features
- Searchable library organized by visualization function
- List view of chart types including bar and pie charts
- Explanations of chart types and visualization techniques
- Blog and Resources sections for learning
- Visualization icons available from the site
Best for: People learning about data visualization or selecting a chart type for data.
Good for
- Covers many chart, map, and diagram types
- Browse by function or by list
- Includes Blog and Resources sections
- Offers visualization icons
DataVizCatalogue at a glance
- Website
- datavizcatalogue.com
- Category
- Design & Creative › Charts & Data Visualization
- Type
- Website
- Pricing
- Not confirmed. Check the site
- Platforms
- Web
- Open source
- Not stated
- Language
- English
- Last checked
- Oct 5, 2026 · Online when checked
- Listed
- Oct 5, 2026
Guides for Charts & Data Visualization
DataVizCatalogue alternatives
Tools and sites you could use instead, ranked by how closely they match.

More than 50 chart types and modules are available in ZingChart, a JavaScript library for data visualization projects.

Seaborn provides statistical data visualization tools and plotting functions for Python.

This Datawrapper repository contains shared JavaScript utility functions for client-side data visualization, released under the MIT license.
FreeOpen source
24 alternatives
Plotly provides an open-source Python library for creating interactive charts and data visualizations.

Use AnyChart, a JavaScript charting library, with its chart types and API documentation.

nivo provides reusable data visualization components for applications built with React.
Popular in Charts & Data Visualization
Well-known listings from the same topic.
Data GIF Makerdatagifmaker.withgoogle.comDatawrapperdatawrapper.deLineGraphMakerlinegraphmaker.coaltairaltair-viz.github.ioCharts Buildercharts.hohli.comPie Chart Makerpiechartmaker.co


DataVizCatalogue FAQ
What is The Data Visualisation Catalogue?
It is a web guide and library that explains chart types and data visualization techniques for learning.
How can I find a chart type on the site?
You can Search by Function or View by List to browse entries such as bar charts, line graphs, and maps.
Does the site provide visualization icons?
Yes. The homepage states that you can get the icons from the site.
Is something wrong or out of date?
Tell us and an editor will check it.
Own this website?
Claim this listing
Claim the listing and suggest updates yourself. An editor checks every claim first.