

ggplot2
ggplot2 creates declarative data visualizations based on the Grammar of Graphics.
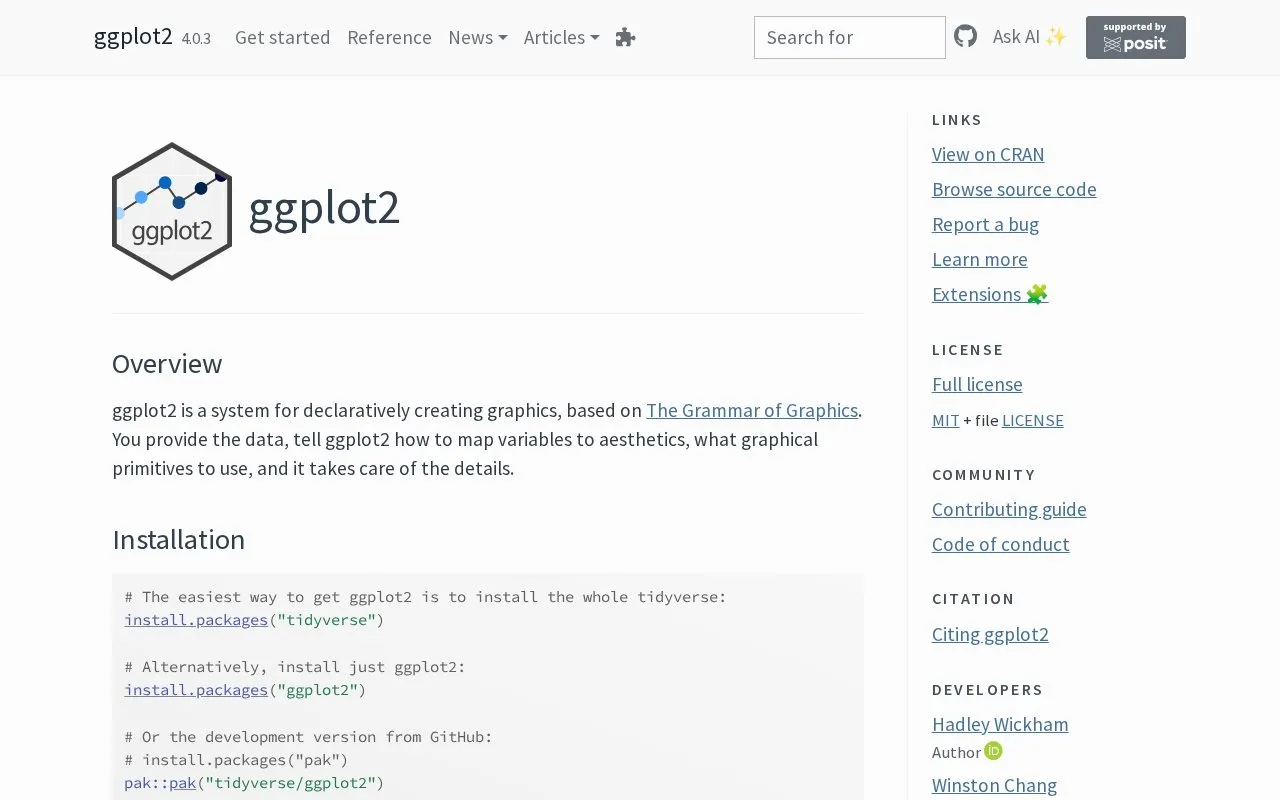
About ggplot2
ggplot2 is an R package for creating data visualizations declaratively, based on The Grammar of Graphics. The user supplies the data and specifies how variables map to aesthetics and which graphical primitives to use, and the package handles the drawing details. The homepage describes a typical workflow: start with ggplot(), supply a dataset and an aesthetic mapping with aes(), then add layers such as geom_point() or geom_histogram(), scales, faceting with facet_wrap(), and coordinate systems such as coord_flip().
The homepage states that ggplot2 is over 10 years old and changes relatively little. New changes are generally added as new functions or arguments rather than altering existing behaviour. A community-maintained list of extensions is available. The site also points to learning resources, including chapters from R for Data Science, online and webinar courses, a graphics cookbook, and a book on the package's theory. Help is available through the Posit Community and Stack Overflow.
Key features
- Declarative graphics built by mapping data variables to aesthetics
- Layered construction with geoms such as geom_point() and geom_histogram()
- Scales, faceting with facet_wrap(), and coordinate systems such as coord_flip()
- Community-maintained gallery of extensions
- Installable from CRAN or the GitHub development version
- Recommended learning resources, including a cookbook of common graphics recipes
Best for: R users who want to create data visualizations using a declarative, layered approach based on the Grammar of Graphics.
Good for
- Changes are generally additive, adding new functions or arguments rather than changing existing behaviour
- Has an extension ecosystem for additional functionality
- Help is available through the Posit Community and Stack Overflow
Watch out for
- Usage and installation are shown in R code, so it requires working in R
- The homepage advises new users to start with a systematic introduction rather than individual documentation pages
- The homepage says the package is hard to describe succinctly, which suggests a learning curve for beginners
ggplot2 at a glance
- Website
- ggplot2.tidyverse.org
- Category
- Design & Creative › Charts & Data Visualization
- Type
- Website
- Pricing
- Not confirmed. Check the site
- Platforms
- Web
- Open source
- Not stated
- Language
- English
- Last checked
- Oct 6, 2026 · Online when checked
- Listed
- Oct 5, 2026
Guides for Charts & Data Visualization
ggplot2 alternatives
Tools and sites you could use instead, ranked by how closely they match.
Percival enables querying complex datasets and producing interactive graphics through a declarative data language.

Vega-Altair provides declarative data visualization tools for Python applications.
The Data Visualisation Catalogue explains chart types and techniques, with a searchable library organized by visualization function.
Pick
24 alternatives
Plotly provides an open-source Python library for creating interactive charts and data visualizations.

nivo provides reusable data visualization components for applications built with React.

Vega-Altair is a Python library for declarative statistical visualization.
Open source
24 alternativesPopular in Charts & Data Visualization
Well-known listings from the same topic.
Data GIF Makerdatagifmaker.withgoogle.comDatawrapperdatawrapper.deLineGraphMakerlinegraphmaker.coCharts Buildercharts.hohli.comPie Chart Makerpiechartmaker.coPlantUMLplantuml.com


ggplot2 FAQ
How do I install ggplot2?
The homepage suggests installing the whole tidyverse with install.packages("tidyverse"), or installing just ggplot2 with install.packages("ggplot2"). The development version can be installed from GitHub using the pak package.
How do I start building a plot?
The homepage says you usually start with ggplot(), supply a dataset and an aesthetic mapping with aes(), and then add layers, scales, faceting specifications and coordinate systems.
Where can I get help with ggplot2?
The homepage lists the Posit Community (formerly RStudio Community) for questions, and Stack Overflow for answers to common questions. It recommends creating a reproducible example before asking on Stack Overflow.
Is something wrong or out of date?
Tell us and an editor will check it.
Own this website?
Claim this listing
Claim the listing and suggest updates yourself. An editor checks every claim first.