

nivo
nivo provides reusable data visualization components for applications built with React.
About nivo
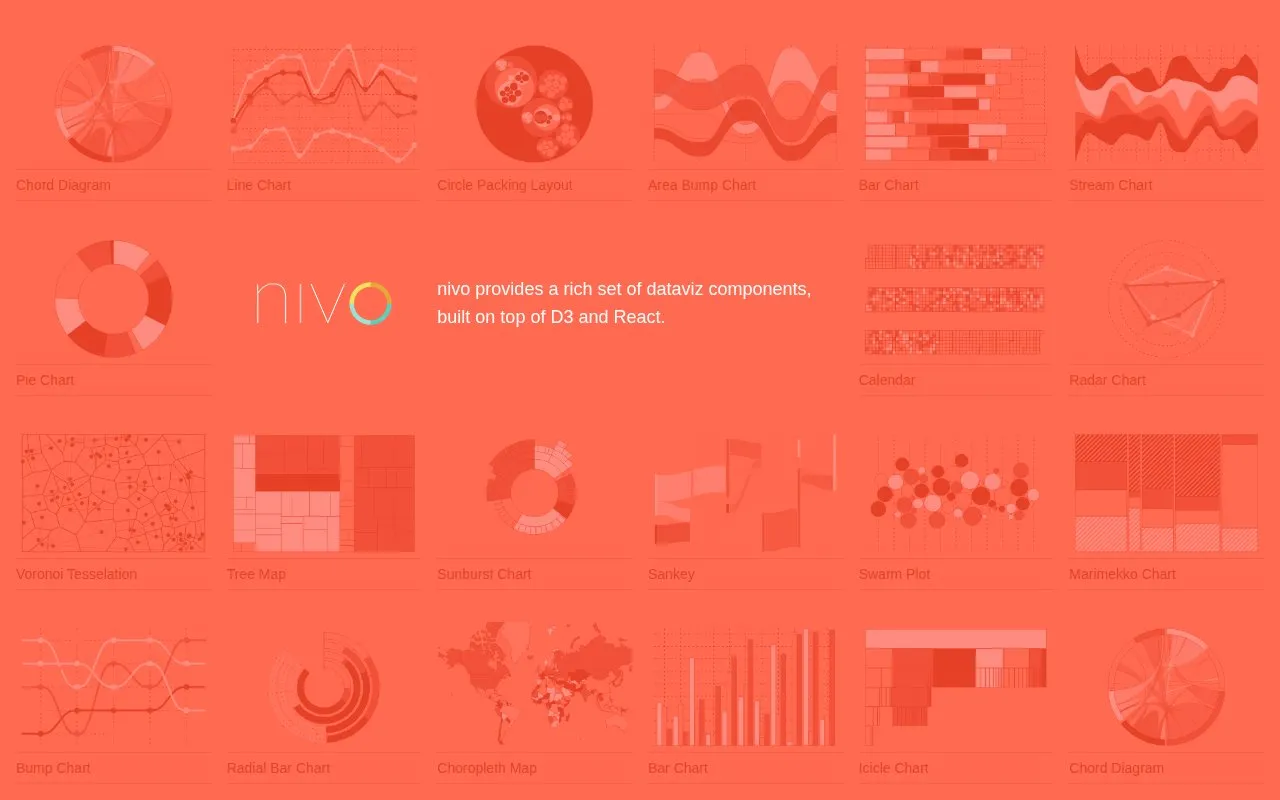
nivo provides reusable data visualization components for applications built with React. The components are built on top of D3 and React.
The homepage lists a range of chart types, including line, bar, pie, radar, stream, calendar, Sankey, tree map, sunburst, icicle, swarm plot, Marimekko, circle packing, Voronoi tessellation, and choropleth map charts. The source does not describe licensing, hosting, or any limits on use, so these are not stated here.
Key features
- Chord diagram component for React applications
- Sankey diagram component for React applications
- Choropleth map component for React applications
- Calendar chart component for React applications
- Swarm plot and Marimekko chart components
- Tree map, sunburst, and icicle chart components
Best for: Developers building React applications who need prebuilt chart and data visualization components.
Good for
- Built on D3 and React, as stated on the homepage
- Covers many chart types, from common bar and line charts to specialized layouts such as Sankey and choropleth maps
nivo at a glance
- Website
- nivo.rocks
- Category
- Design & Creative › Charts & Data Visualization
- Type
- Website
- Pricing
- Not confirmed. Check the site
- Platforms
- Web
- Open source
- Not stated
- Language
- English
- Last checked
- Oct 6, 2026 · Online when checked
- Listed
- Oct 5, 2026
Guides for Charts & Data Visualization
nivo alternatives
Tools and sites you could use instead, ranked by how closely they match.

C3.js provides reusable charts for websites through a library built on D3.js.

Tree generates ASCII diagrams of folder structures as a browser utility written in TypeScript and React.
The Data Visualisation Catalogue explains chart types and techniques, with a searchable library organized by visualization function.
Pick
24 alternatives
Plotly provides an open-source Python library for creating interactive charts and data visualizations.

ggplot2 creates declarative data visualizations based on the Grammar of Graphics.

amCharts provides JavaScript charting components, maps, stock charts, and Gantt charts.
Popular in Charts & Data Visualization
Well-known listings from the same topic.
Data GIF Makerdatagifmaker.withgoogle.comDatawrapperdatawrapper.deLineGraphMakerlinegraphmaker.coaltairaltair-viz.github.ioCharts Buildercharts.hohli.comPie Chart Makerpiechartmaker.co


Is something wrong or out of date?
Tell us and an editor will check it.
Own this website?
Claim this listing
Claim the listing and suggest updates yourself. An editor checks every claim first.