

amCharts
amCharts provides JavaScript charting components, maps, stock charts, and Gantt charts.
About amCharts
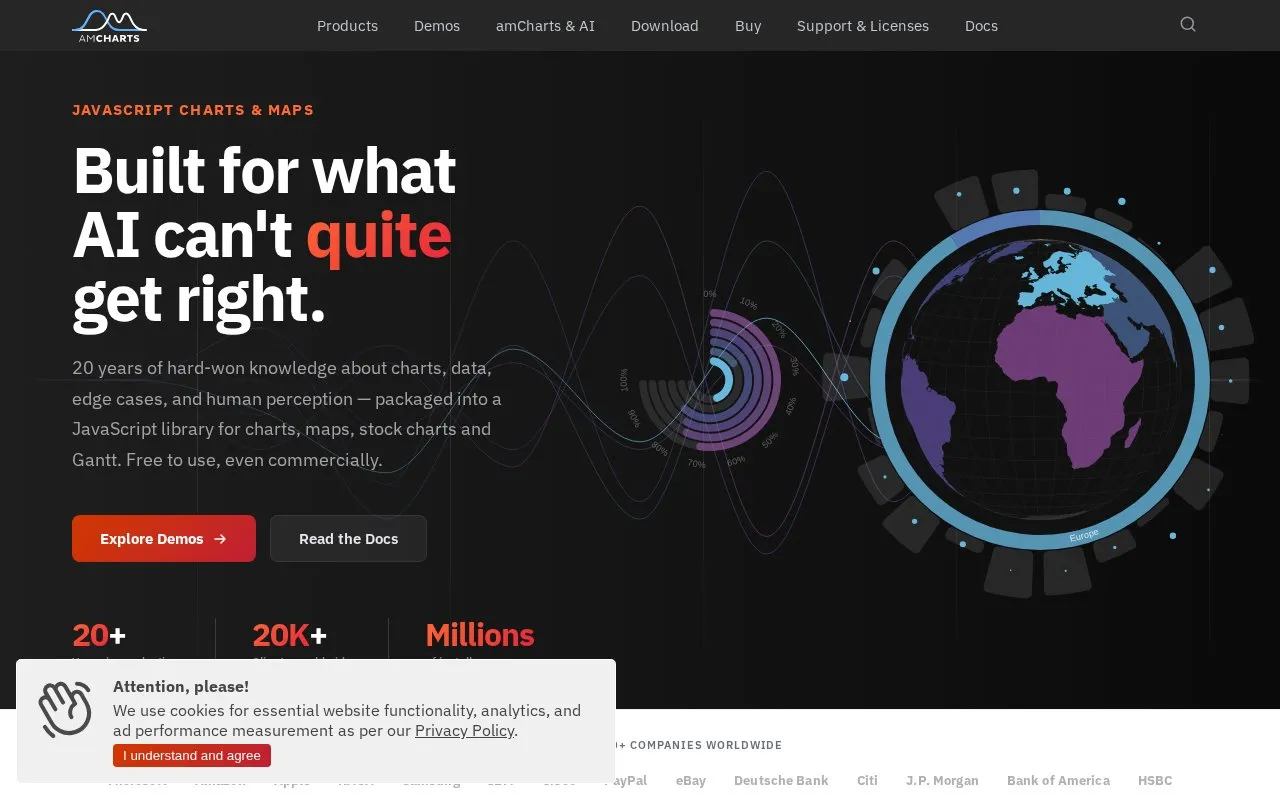
amCharts is a JavaScript and TypeScript charting library for web developers. It covers 60+ chart types along with interactive geographic maps, financial stock charts and Gantt timelines, and draws on HTML5 Canvas by default with a setting to switch to SVG. Legends, tooltips, zoom, scrollbars, responsive layouts and accessibility features such as screen reader support, keyboard navigation and ARIA attributes are described as built in rather than added through plugins. Charts can also be composed in one container, stacked, gridded or overlaid.
The library is free to use, including commercially, provided a small amCharts backlink is retained; paid annual and perpetual plans remove it and add benefits such as free version upgrades and source code access. The entry is aimed at JavaScript developers, so some familiarity with code is expected. Bundled map data and components such as the stock indicators and Gantt tools vary by module.
Key features
- 60+ chart types including Sankey, treemap, spiral and Voronoi
- Interactive geo maps with bundled GeoJSON datasets and point clustering
- Stock charts with 34 indicators, 22 drawing tools, multi-panel layouts
- Gantt charts with drag-and-drop timelines, dependency links and resource allocation
- Canvas rendering by default, switchable to SVG with one setting
- Accessibility: screen reader support, keyboard navigation and ARIA attributes
Best for: JavaScript and TypeScript developers who need a broad set of interactive charts, maps, financial charts or Gantt timelines inside a web application.
Good for
- Free to use, including on commercial projects, with a small backlink
- Wide single-library coverage spanning charts, maps, stock charts and Gantt
- Accessibility, responsive layouts and composable layouts described as built in
Watch out for
- The free tier requires keeping an amCharts backlink; paid plans remove it
- It is a proprietary library, so source code access is tied to a paid plan
- The company notes the library has historically had a learning curve
amCharts at a glance
- Website
- amcharts.com
- Category
- Design & Creative › Charts & Data Visualization
- Type
- Online tool
- Pricing
- Not confirmed. Check the site
- Platforms
- Web
- Open source
- Not stated
- Language
- English
- Good for
- Developers
- Last checked
- Oct 6, 2026 · Online when checked
- Listed
- Oct 5, 2026
Guides for Charts & Data Visualization
amCharts alternatives
Tools and sites you could use instead, ranked by how closely they match.

More than 50 chart types and modules are available in ZingChart, a JavaScript library for data visualization projects.

Interactive charts for multidimensional datasets can be built with dc.js, a JavaScript library that supports Crossfilter.

Pie Chart Maker creates customizable pie charts and lets users download them as JPG, PNG, or SVG files.
Free
24 alternatives
Bar, line, area, and scatter charts can be created with dimple, an open-source charting API for D3.js.
Open source
24 alternatives
Gephi explores and visualizes graph networks, with algorithms for community detection, centrality measures, and clustering.
SankeyMATIC builds flow diagrams for comparing quantities across stages, with examples covering budgets, results, and processes.
Popular in Charts & Data Visualization
Well-known listings from the same topic.
Data GIF Makerdatagifmaker.withgoogle.comDatawrapperdatawrapper.deDataVizCataloguedatavizcatalogue.comLineGraphMakerlinegraphmaker.coaltairaltair-viz.github.ioCharts Buildercharts.hohli.com


amCharts FAQ
Can amCharts be used commercially for free?
Yes. The free tier covers commercial projects, unlimited users and pages, with a small amCharts backlink. Removing the backlink requires a paid plan.
What rendering technology does it use?
It draws on HTML5 Canvas by default, which the source describes as faster with a smaller memory footprint. A single setting switches rendering to SVG.
How are the paid plans structured?
An annual plan starts at $80 per year per developer seat, and a perpetual plan starts at $180 one-time per developer seat. Annual includes free version upgrades and source code access.
Is something wrong or out of date?
Tell us and an editor will check it.
Own this website?
Claim this listing
Claim the listing and suggest updates yourself. An editor checks every claim first.