
htmlwidgets
htmlwidgets lets R packages create interactive visualizations for the web.
About htmlwidgets
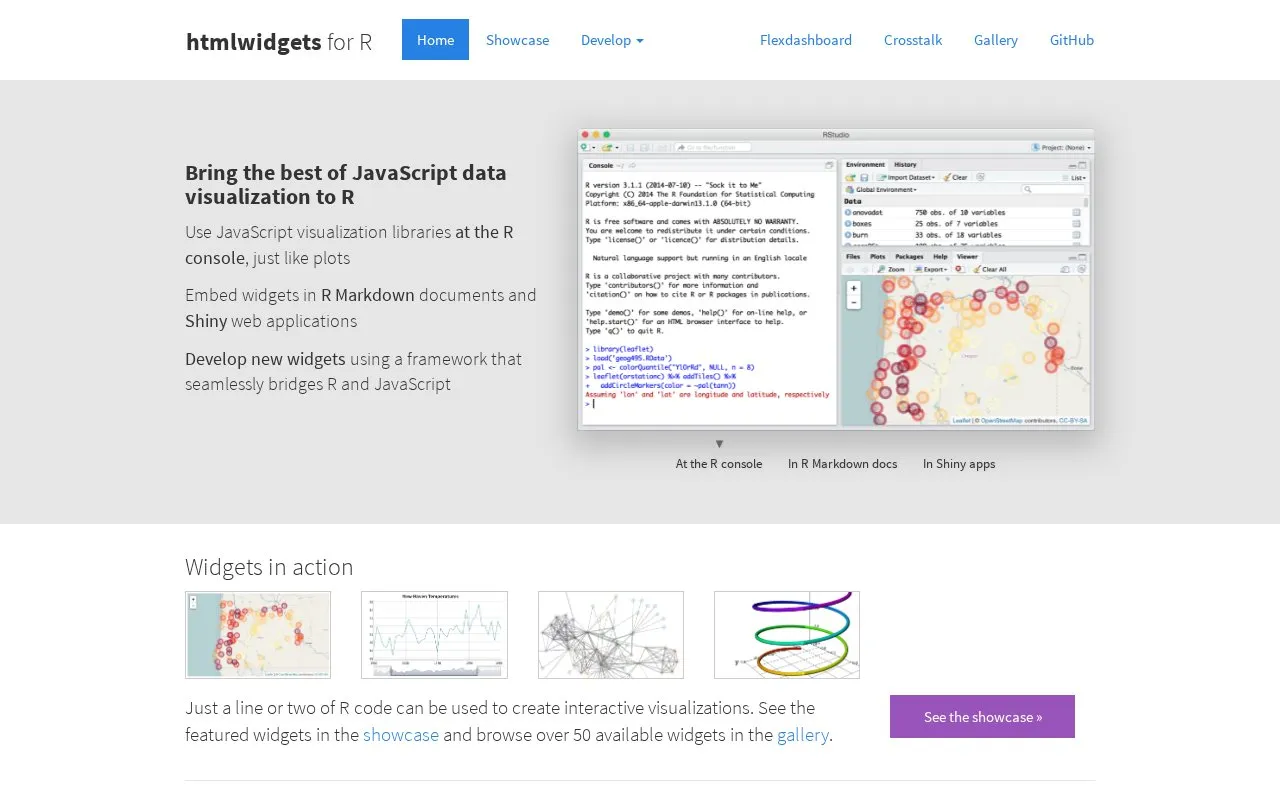
htmlwidgets is a package framework for R that turns R code into interactive web visualizations. It lets R users work with JavaScript visualization libraries such as D3, Leaflet, and Plotly without writing JavaScript. According to the homepage, a line or two of R code is enough to produce a graphic or map.
Widgets can be used at the R console, embedded in R Markdown reports, and included in Shiny web applications. Multiple widgets can be combined into dashboards with the flexdashboard package, and linked brushing and client-side filtering between widgets are supported through crosstalk. The homepage notes that more complex interactions require Shiny. The homepage also lists a gallery of more than 50 widgets and a framework for developing new widgets.
Key features
- Creates interactive web visualizations from a line or two of R code
- Wraps JavaScript visualization libraries for use in R
- Runs at the R console, in R Markdown reports, and in Shiny apps
- Combines multiple widgets into dashboards using flexdashboard
- Links widgets through linked brushing and client-side filtering via crosstalk
- Provides a framework for developing new R and JavaScript widgets
Best for: R users who want interactive charts, maps, or tables in reports, Shiny apps, or dashboards.
Good for
- Produces interactive versions of R plots with only a line or two of code
- Works across the R console, R Markdown documents, and Shiny applications
- Gives R users access to established JavaScript visualization libraries
Watch out for
- Linked brushing and client-side filtering are the widget interactions listed for crosstalk
- More sophisticated interactions require Shiny, according to the homepage
htmlwidgets at a glance
- Website
- htmlwidgets.org
- Category
- Design & Creative › Charts & Data Visualization
- Type
- Website
- Pricing
- Not confirmed. Check the site
- Platforms
- Web
- Open source
- Not stated
- Last checked
- Oct 6, 2026 · Online when checked
- Listed
- Oct 5, 2026
Guides for Charts & Data Visualization
htmlwidgets alternatives
Tools and sites you could use instead, ranked by how closely they match.

Plotly provides an open-source Python library for creating interactive charts and data visualizations.
The Data Visualisation Catalogue explains chart types and techniques, with a searchable library organized by visualization function.
Pick
24 alternativesLeaflet supports interactive maps in JavaScript and can be used from R applications.

Google Data Studio connects to data sources and turns them into interactive dashboards and reports for business decisions.
amCharts lets users build interactive charts and maps in a browser from templates, then export, embed, or publish them.
Percival enables querying complex datasets and producing interactive graphics through a declarative data language.
Popular in Charts & Data Visualization
Well-known listings from the same topic.
Data GIF Makerdatagifmaker.withgoogle.comDatawrapperdatawrapper.deLineGraphMakerlinegraphmaker.coaltairaltair-viz.github.ioCharts Buildercharts.hohli.comPie Chart Makerpiechartmaker.co


htmlwidgets FAQ
Can htmlwidgets be combined into a dashboard?
Yes. The homepage says multiple htmlwidgets can be composed into a dashboard using the flexdashboard package, which supports row- and column-based layouts.
How can widgets respond to each other?
Widgets can be wired together with the crosstalk package, which currently supports linked brushing and client-side filtering. The homepage says Shiny can be used for more complex interactions.
Is something wrong or out of date?
Tell us and an editor will check it.
Own this website?
Claim this listing
Claim the listing and suggest updates yourself. An editor checks every claim first.