
leaflet
Leaflet supports interactive maps in JavaScript and can be used from R applications.
About leaflet
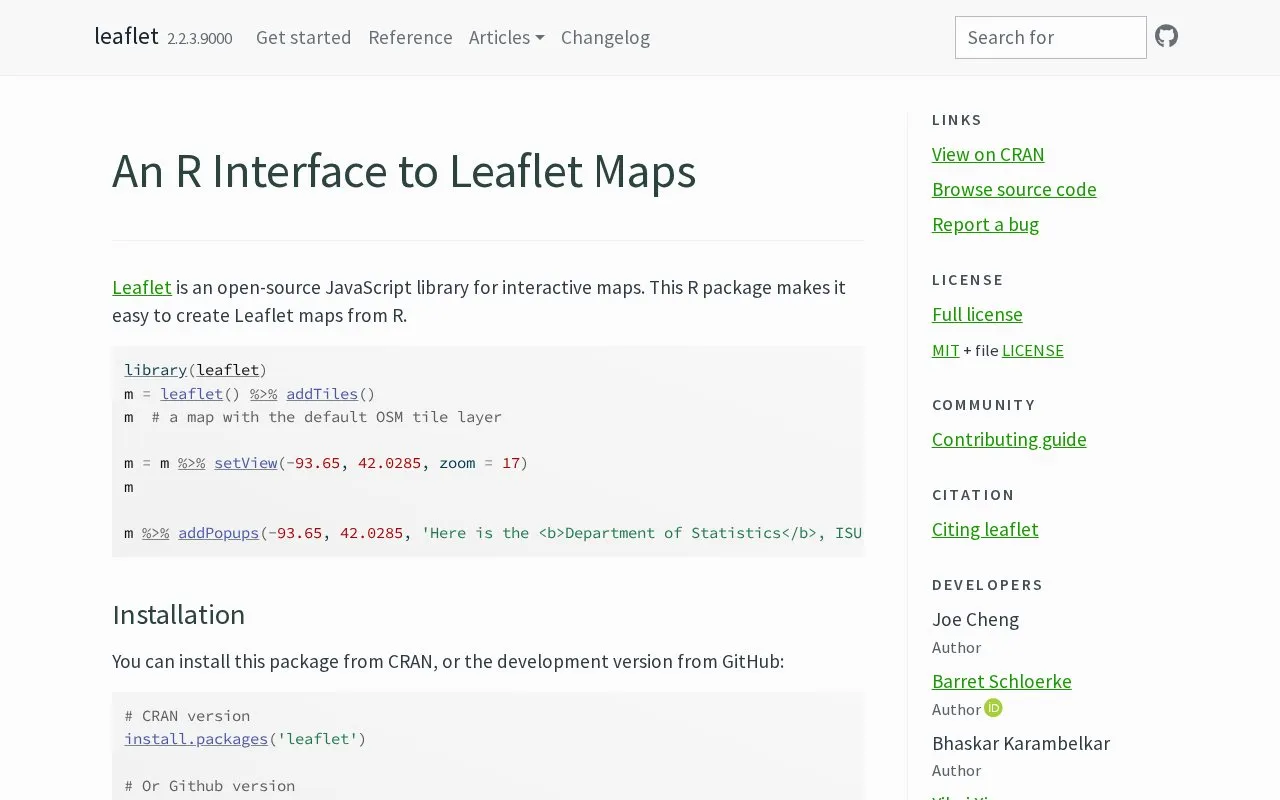
Leaflet is an R package that provides an interface to the Leaflet JavaScript library for interactive maps. It uses the htmlwidgets package to create and customize maps from R, including adding tile layers, setting a view by coordinates and zoom level, and adding popups.
Maps can be used directly from the R console, from RStudio, in Shiny applications and R Markdown documents. The package can be installed from CRAN, with a development version available from GitHub.
Key features
- Create interactive Leaflet maps directly from R code
- Add default OSM tile layer to maps
- Set map center and zoom with coordinates
- Add popups with text at specific locations
- Use maps in Shiny applications and R Markdown
- Use maps from R console and RStudio
Best for: R users who need to create interactive web maps for analysis, apps, or documents.
Good for
- Based on open-source Leaflet JavaScript library
- Works from R console, RStudio, Shiny, and R Markdown
- Available from CRAN with development version on GitHub
leaflet at a glance
- Website
- rstudio.github.io/leaflet
- Category
- Design & Creative › Charts & Data Visualization
- Type
- Website
- Pricing
- Not confirmed. Check the site
- Platforms
- Web
- Open source
- Not stated
- Language
- English
- Last checked
- Oct 5, 2026 · Online when checked
- Listed
- Oct 5, 2026
Guides for Charts & Data Visualization
leaflet alternatives
Tools and sites you could use instead, ranked by how closely they match.
amCharts lets users build interactive charts and maps in a browser from templates, then export, embed, or publish them.

Datawrapper creates interactive charts, maps, and tables in a web app without requiring code, according to its site.
Pick
24 alternatives
amCharts provides JavaScript charting components, maps, stock charts, and Gantt charts.

Highcharts provides JavaScript charting for dashboards, maps, stock data, grids, and web applications.

Flourish creates charts, maps, and interactive content for data storytelling without requiring coding.

Interactive charts for multidimensional datasets can be built with dc.js, a JavaScript library that supports Crossfilter.
Popular in Charts & Data Visualization
Well-known listings from the same topic.
Data GIF Makerdatagifmaker.withgoogle.comDataVizCataloguedatavizcatalogue.comLineGraphMakerlinegraphmaker.coaltairaltair-viz.github.ioCharts Buildercharts.hohli.comPie Chart Makerpiechartmaker.co


leaflet FAQ
How can the package be installed?
Install the CRAN version with install.packages('leaflet'), or the development version with devtools::install_github('rstudio/leaflet').
Where can the maps be used?
Maps can be used directly from the R console, from RStudio, in Shiny applications and R Markdown documents.
Is something wrong or out of date?
Tell us and an editor will check it.
Own this website?
Claim this listing
Claim the listing and suggest updates yourself. An editor checks every claim first.