

Flourish
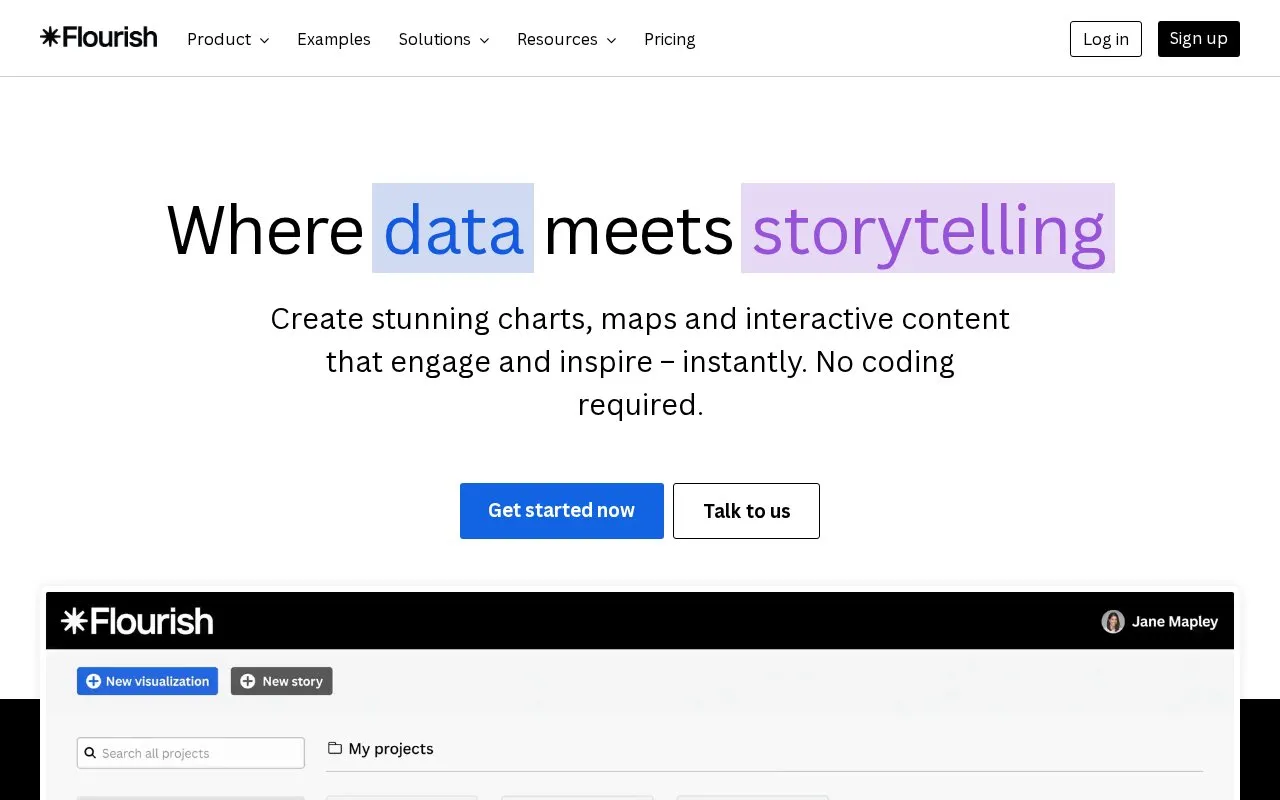
Flourish creates charts, maps, and interactive content for data storytelling without requiring coding.
About Flourish
Flourish is a web-based platform for creating charts, maps and interactive content from data without coding. Users import data into templates and share or embed the results on websites, in presentations and as social media assets, with output that adapts to different screens.
It supports narrative formats such as scrollytelling, interactive presentations and audio-driven stories, with team collaboration, brand customization, an Assistant and Connector for AI-assisted work, and an SDK and API for custom templates and dashboard integration. Its focus is data storytelling for presentations and publications rather than business intelligence.
Key features
- Create charts, maps and interactive visuals without coding
- Import data into template-based visualizations
- Embed visuals in websites, presentations and social assets
- Build scrollytelling, interactive presentations and audio-driven stories
- Use SDK to build custom visualization templates
- Create mobile-optimized visuals that adapt to screens
Best for: Teams in newsrooms, marketing, education, nonprofits, government and professional services that publish data stories.
Good for
- No specific technical skills needed to use template system
- Outputs work across platforms and are optimized for mobile viewing
- Supports narrative formats such as scrollytelling and interactive presentations
Watch out for
- Not typically regarded as a business intelligence tool
Flourish at a glance
- Website
- flourish.studio
- Category
- Design & Creative › Charts & Data Visualization
- Type
- Online tool
- Pricing
- Not confirmed. Check the site
- Platforms
- Web
- Open source
- Not stated
- Language
- English
- Last checked
- Oct 5, 2026 · Online when checked
- Listed
- Oct 5, 2026
Guides for Charts & Data Visualization
Flourish alternatives
Tools and sites you could use instead, ranked by how closely they match.

Datawrapper creates interactive charts, maps, and tables in a web app without requiring code, according to its site.
Pick
24 alternativesFlowgorithm provides a flowchart-based programming language, with multilingual navigation and learning resources on its homepage.

Highcharts provides JavaScript charting for dashboards, maps, stock data, grids, and web applications.
amCharts lets users build interactive charts and maps in a browser from templates, then export, embed, or publish them.

amCharts provides JavaScript charting components, maps, stock charts, and Gantt charts.

Interactive charts for multidimensional datasets can be built with dc.js, a JavaScript library that supports Crossfilter.
Popular in Charts & Data Visualization
Well-known listings from the same topic.
Data GIF Makerdatagifmaker.withgoogle.comDataVizCataloguedatavizcatalogue.comLineGraphMakerlinegraphmaker.coaltairaltair-viz.github.ioCharts Buildercharts.hohli.comPie Chart Makerpiechartmaker.co


Flourish FAQ
What is Flourish?
It is a data visualization platform for telling stories with data using templates and embedding options for interactive visuals.
How does Flourish differ from other data visualization tools?
It uses a template-based interface that does not require technical skills, supports scrollytelling and interactive presentations, offers an SDK for custom templates, and produces mobile-optimized output.
Is Flourish a business intelligence tool?
No. Its primary focus is data storytelling for presentations and digital publications, though its templates and API can support data exploration and dashboard integration.
Is something wrong or out of date?
Tell us and an editor will check it.
Own this website?
Claim this listing
Claim the listing and suggest updates yourself. An editor checks every claim first.