

High Charts
Highcharts provides JavaScript charting for dashboards, maps, stock data, grids, and web applications.
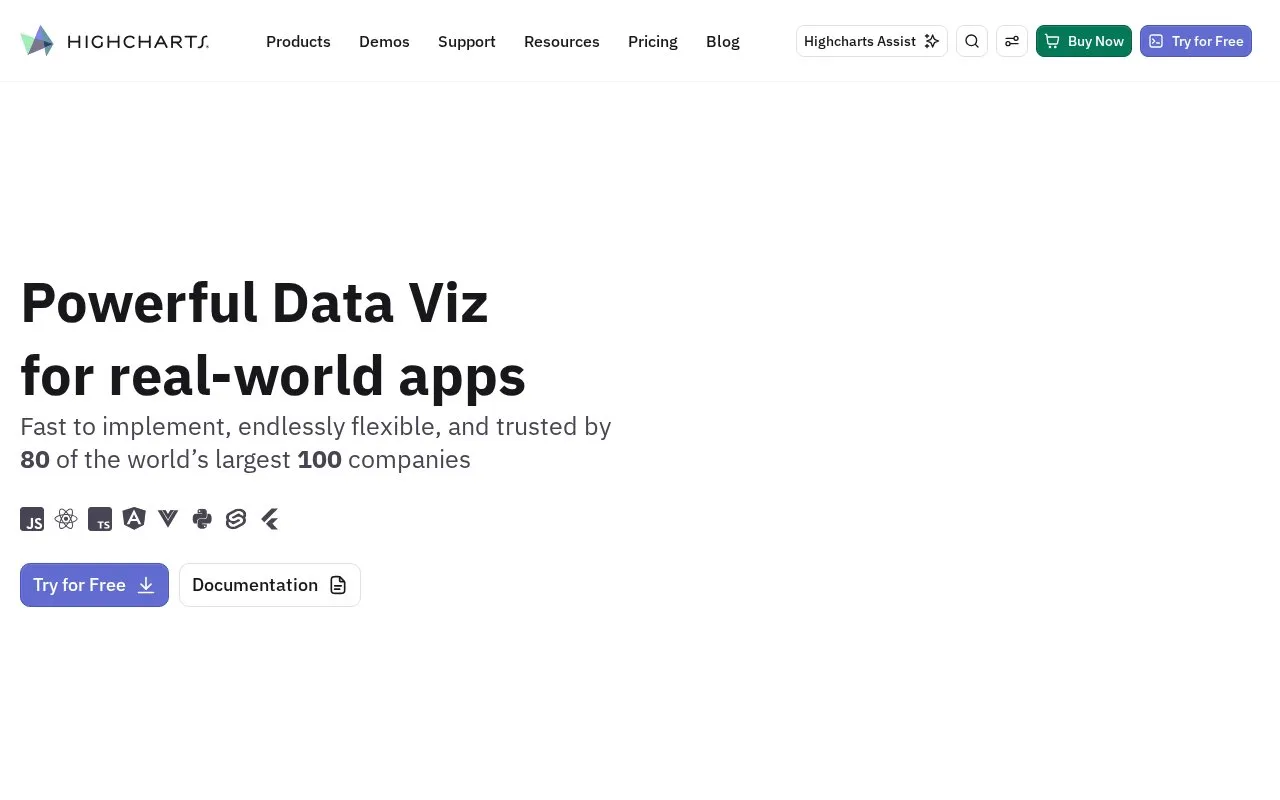
About High Charts
Highcharts is a JavaScript charting library for building interactive data visualizations in web applications. The homepage describes use in dashboards, maps, stock data, and grids, and lists product modules including Core, Stock, Maps, Gantt, Grid, and Dashboards. Charts are configured with JavaScript and can be integrated as components in frameworks such as React, Angular, and Vue.
The library includes adaptive themes, responsive resizing, and an accessibility module that the homepage says can help meet compliance standards with minimal configuration. The homepage also describes Highcharts Orbit, a feature that adds forecasting, anomaly detection, and AI insights to charts. Pricing is not stated in the source, and the library is not open source.
Key features
- Interactive charts built with a few lines of code and data
- Adaptive theme that follows the user's preferred color scheme
- Responsive charts that adjust to their container and reposition labels and legends
- Accessibility module intended to help meet compliance standards with minimal configuration
- Officially supported integrations for React, Angular, and Vue
- Highcharts Orbit adds forecasting, anomaly detection, and AI insights
Best for: Developers and teams building charts and data dashboards inside JavaScript web applications, including internal analytics tools.
Good for
- Integrations with React, Angular, and Vue are described as officially supported and professionally maintained.
- Adaptive theming and responsive layout are included in the library.
- Chart styling and settings can be customized to match a data model and visual design.
Watch out for
- The library is not open source.
- The source does not state which plans include the Orbit features.
- Pricing information is not available in the source.
High Charts at a glance
- Website
- highcharts.com
- Category
- Design & Creative › Charts & Data Visualization
- Type
- Online tool
- Pricing
- Not confirmed. Check the site
- Platforms
- Web
- Open source
- Not stated
- Language
- English
- Good for
- Developers
- Last checked
- Oct 6, 2026 · Online when checked
- Listed
- Oct 5, 2026
Guides for Charts & Data Visualization
High Charts alternatives
Tools and sites you could use instead, ranked by how closely they match.

amCharts provides JavaScript charting components, maps, stock charts, and Gantt charts.

highcharter wraps the Highcharts JavaScript library for plotting R objects.

Flourish creates charts, maps, and interactive content for data storytelling without requiring coding.

More than 50 chart types and modules are available in ZingChart, a JavaScript library for data visualization projects.

Bokeh creates interactive plots, dashboards, and data applications in Python.

Datawrapper creates interactive charts, maps, and tables in a web app without requiring code, according to its site.
Pick
24 alternativesPopular in Charts & Data Visualization
Well-known listings from the same topic.
Data GIF Makerdatagifmaker.withgoogle.comDataVizCataloguedatavizcatalogue.comLineGraphMakerlinegraphmaker.coaltairaltair-viz.github.ioCharts Buildercharts.hohli.comPie Chart Makerpiechartmaker.co


High Charts FAQ
Which frameworks does Highcharts integrate with?
The homepage names React, Angular, and Vue as frameworks with integrations that allow charts to be added as components.
Is Highcharts open source?
No. The directory listing records the tool as not open source.
Is something wrong or out of date?
Tell us and an editor will check it.
Own this website?
Claim this listing
Claim the listing and suggest updates yourself. An editor checks every claim first.