

AnyChart
Use AnyChart, a JavaScript charting library, with its chart types and API documentation.
About AnyChart
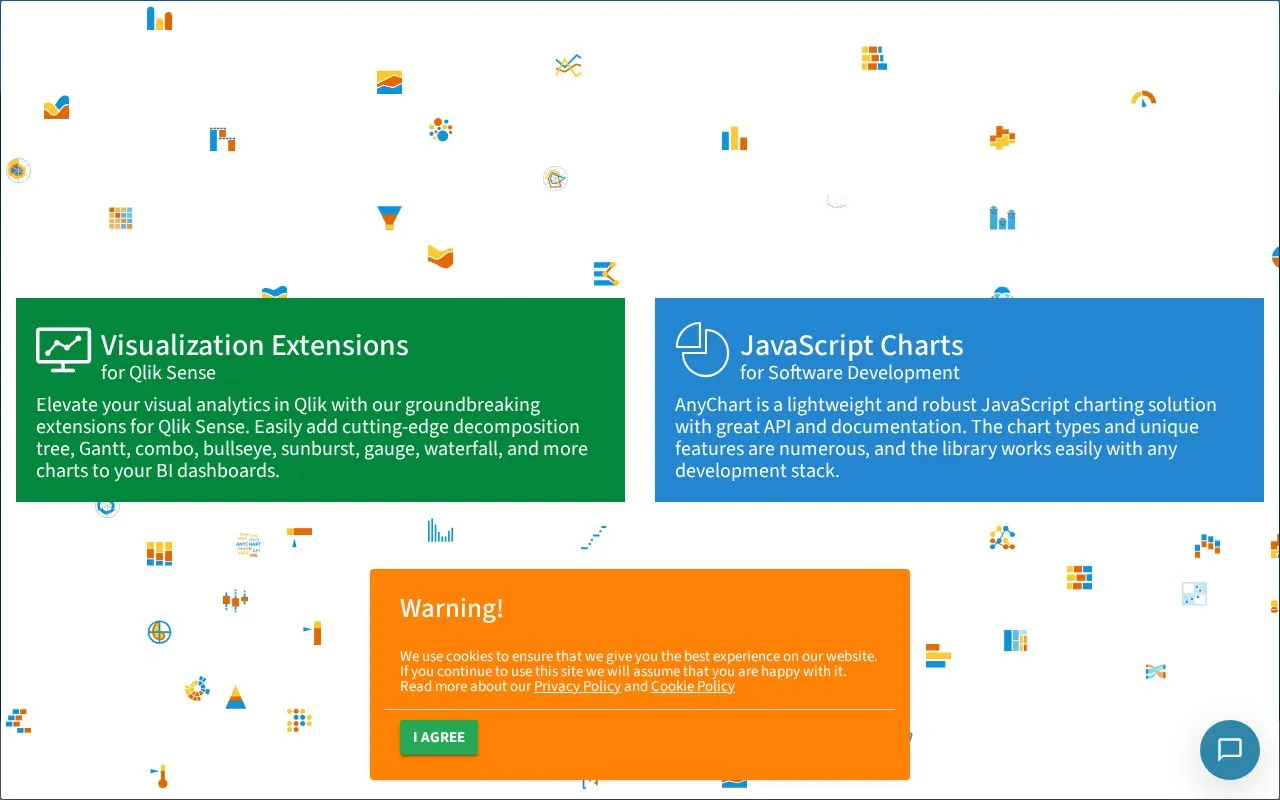
AnyChart provides JavaScript libraries for embedding interactive charts in web, desktop, and mobile apps. Its product family includes general charts, stock and timeline charts, map charts with drilldown and routes, and Gantt, resource, and PERT charts, along with extensions for Qlik Sense.
It can be used with development stacks such as PHP, React, Angular, and Node.js, and supports data from XML, JSON, CSV, MySQL, and MongoDB.
Key features
- Embed interactive JavaScript charts in web, desktop, and mobile apps
- Visualize financial or timeline-based data with stock charts
- Add interactive map charts with drilldown and routes
- Create Gantt, resource, and PERT charts
- Add decomposition tree, gauge, waterfall, and other charts to Qlik Sense
- Use XML, JSON, CSV, MySQL, and MongoDB as data sources
Best for: Developers who need to embed interactive charts, maps, or Gantt charts in apps or Qlik Sense dashboards.
Good for
- Product family covers general charts, stock, maps, Gantt, and Qlik extensions
- Works with multiple development stacks including React, Angular, and Node.js
- Accepts multiple data sources including XML, JSON, CSV, MySQL, and MongoDB
AnyChart at a glance
- Website
- anychart.com
- Category
- Design & Creative › Charts & Data Visualization
- Type
- Online tool
- Pricing
- Not confirmed. Check the site
- Platforms
- Web
- Open source
- Not stated
- Language
- English
- Last checked
- Oct 5, 2026 · Online when checked
- Listed
- Oct 5, 2026
Guides for Charts & Data Visualization
AnyChart alternatives
Tools and sites you could use instead, ranked by how closely they match.

More than 50 chart types and modules are available in ZingChart, a JavaScript library for data visualization projects.
The Data Visualisation Catalogue explains chart types and techniques, with a searchable library organized by visualization function.
Pick
24 alternatives
Dia is free, open source drawing software for structured diagrams, with downloads, shapes, and documentation.

Interactive charts for multidimensional datasets can be built with dc.js, a JavaScript library that supports Crossfilter.

Highcharts provides JavaScript charting for dashboards, maps, stock data, grids, and web applications.

amCharts provides JavaScript charting components, maps, stock charts, and Gantt charts.
Popular in Charts & Data Visualization
Well-known listings from the same topic.
Data GIF Makerdatagifmaker.withgoogle.comDatawrapperdatawrapper.deLineGraphMakerlinegraphmaker.coaltairaltair-viz.github.ioCharts Buildercharts.hohli.comPie Chart Makerpiechartmaker.co


AnyChart FAQ
What types of visualizations does AnyChart provide?
General charts, stock or timeline charts, map charts with drilldown and routes, and Gantt, resource, and PERT charts, plus extensions for Qlik Sense.
Which development stacks can it be used with?
Listed stacks include PHP, ASP.NET, R, Ruby on Rails, Node.js, Angular, Meteor, Ember, React, Qlik, and jQuery.
Which data sources are supported?
Listed sources include XML, JSON, CSV, MySQL, and MongoDB.
Is something wrong or out of date?
Tell us and an editor will check it.
Own this website?
Claim this listing
Claim the listing and suggest updates yourself. An editor checks every claim first.