

highcharter
highcharter wraps the Highcharts JavaScript library for plotting R objects.
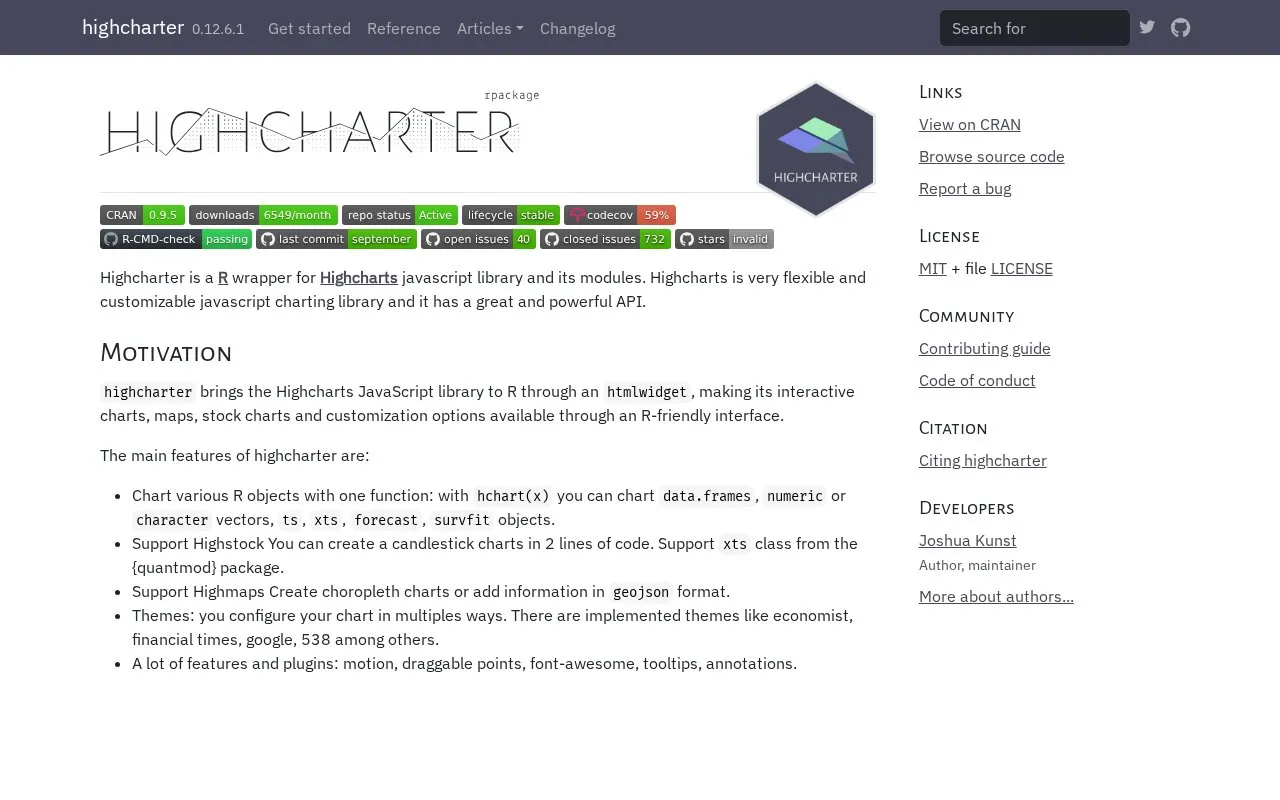
About highcharter
highcharter is an R package that wraps the Highcharts JavaScript charting library. It brings Highcharts' interactive charts, maps, and stock charts into R through an htmlwidget, with an R-friendly interface for configuring them. The main entry point, hchart(), can plot data frames, numeric or character vectors, ts, xts, forecast, and survfit objects.
highcharter depends on Highcharts, which is a commercial library. Highcharts offers a commercial license and a free non-commercial license, and it is not free for commercial and governmental use. The project's homepage states that the highcharter license does not provide or imply a license for Highcharts, so users should review Highcharts' licensing terms before using the package. The package is available on CRAN, and a development version can be installed from GitHub.
Key features
- One hchart() function plots data frames, vectors, ts, xts, forecast, and survfit objects
- Highstock support for candlestick and other stock charts, including xts input
- Highmaps support for choropleth charts and GeoJSON data
- Built-in chart themes such as Economist, Financial Times, Google, and 538
- Plugins for motion, draggable points, Font Awesome icons, tooltips, and annotations
Best for: R users who want interactive Highcharts charts, maps, or stock charts created from R code, and who have confirmed that their use of Highcharts is licensed.
Good for
- Plots several common R object types through a single function, hchart()
- Supports stock charts, choropleth maps, and built-in chart themes
- Makes Highcharts customization options available through an R-friendly interface
Watch out for
- Depends on Highcharts, a commercial library that is not free for commercial and governmental use
- The highcharter license does not provide or imply a license for Highcharts
- Users must review Highcharts licensing options and terms before using the software
highcharter at a glance
- Website
- jkunst.com/highcharter
- Category
- Design & Creative › Charts & Data Visualization
- Type
- Online tool
- Pricing
- Not confirmed. Check the site
- Platforms
- Web
- Open source
- Not stated
- Language
- English
- Last checked
- Oct 6, 2026 · Online when checked
- Listed
- Oct 5, 2026
Guides for Charts & Data Visualization
highcharter alternatives
Tools and sites you could use instead, ranked by how closely they match.

Highcharts provides JavaScript charting for dashboards, maps, stock data, grids, and web applications.

Seaborn provides statistical data visualization tools and plotting functions for Python.

Use AnyChart, a JavaScript charting library, with its chart types and API documentation.

More than 50 chart types and modules are available in ZingChart, a JavaScript library for data visualization projects.

Interactive charts for multidimensional datasets can be built with dc.js, a JavaScript library that supports Crossfilter.

For custom data visualizations in JavaScript, D3.js provides tools for scales, axes, transitions, and DOM updates.
Popular in Charts & Data Visualization
Well-known listings from the same topic.
Data GIF Makerdatagifmaker.withgoogle.comDatawrapperdatawrapper.deDataVizCataloguedatavizcatalogue.comLineGraphMakerlinegraphmaker.coaltairaltair-viz.github.ioCharts Buildercharts.hohli.com


highcharter FAQ
How do I install highcharter?
The CRAN version installs with install.packages("highcharter"). The development version installs from GitHub with remotes::install_github("jbkunst/highcharter").
Does installing highcharter give me a license for Highcharts?
No. The project's homepage states that the highcharter license neither provides nor implies a license for Highcharts. Users should review the Highcharts license options before use.
Is something wrong or out of date?
Tell us and an editor will check it.
Own this website?
Claim this listing
Claim the listing and suggest updates yourself. An editor checks every claim first.