

C3.js
C3.js provides reusable charts for websites through a library built on D3.js.
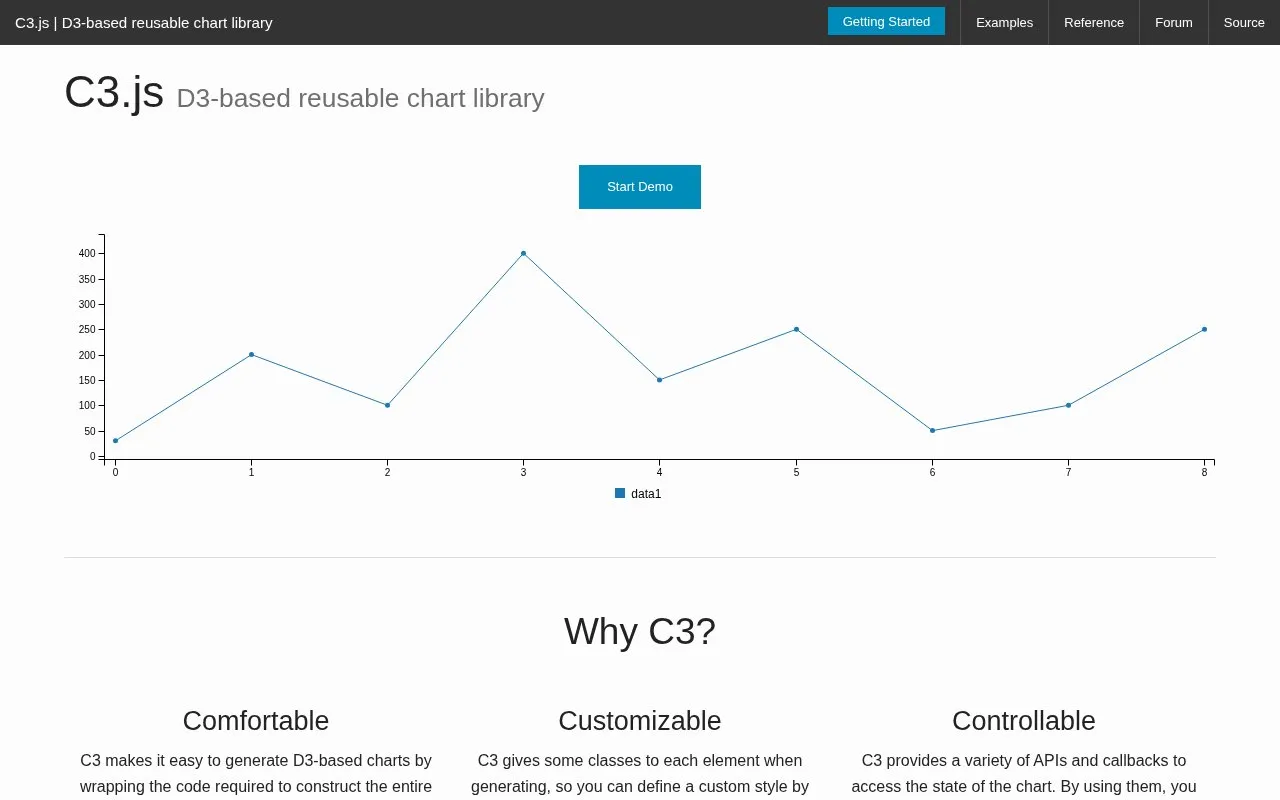
About C3.js
C3.js is a D3.js-based reusable chart library designed for use on websites. It simplifies generating D3-based charts by wrapping the code required to construct full charts, eliminating the need for users to write raw D3 code for common chart types. The library assigns CSS classes to each generated chart element to support custom styling, allows direct extension of chart structure via D3, and provides a range of APIs and callbacks to access chart state and update charts after they are rendered. Due to its dependency on D3, C3.js only supports modern web browsers.
Key features
- Wraps D3 code to generate charts without raw D3 writing
- Assigns CSS classes to chart elements for custom styling
- Allows direct chart structure extension via D3
- Provides APIs and callbacks to access chart state
- Supports updating charts after they are rendered
- Only compatible with modern web browsers
Best for: Web developers building websites who want to add D3-based charts without writing raw D3 code.
Good for
- Eliminates need to write raw D3 code for chart generation
- Supports CSS-based customization and direct D3 extension
- Provides APIs and callbacks for post-render chart updates
Watch out for
- Only supports modern web browsers due to D3 dependency
C3.js at a glance
- Website
- c3js.org
- Category
- Design & Creative › Charts & Data Visualization
- Type
- Online tool
- Pricing
- Not confirmed. Check the site
- Platforms
- Web
- Open source
- Not stated
- Last checked
- Oct 6, 2026 · Online when checked
- Listed
- Oct 5, 2026
Guides for Charts & Data Visualization
C3.js alternatives
Tools and sites you could use instead, ranked by how closely they match.

nivo provides reusable data visualization components for applications built with React.

Interactive charts for multidimensional datasets can be built with dc.js, a JavaScript library that supports Crossfilter.

Datawrapper creates interactive charts, maps, and tables in a web app without requiring code, according to its site.
Pick
24 alternatives
Use AnyChart, a JavaScript charting library, with its chart types and API documentation.

More than 50 chart types and modules are available in ZingChart, a JavaScript library for data visualization projects.
pygal provides Python tools for creating charts and visualizing data in applications.
Popular in Charts & Data Visualization
Well-known listings from the same topic.
Data GIF Makerdatagifmaker.withgoogle.comDataVizCataloguedatavizcatalogue.comLineGraphMakerlinegraphmaker.coaltairaltair-viz.github.ioCharts Buildercharts.hohli.comPie Chart Makerpiechartmaker.co


C3.js FAQ
What underlying library does C3.js use?
D3.js
Can charts generated with C3.js be modified after rendering?
Yes, using the library's APIs and callbacks to update chart state.
Is raw D3 code required to create charts with C3.js?
No, C3.js wraps the D3 code needed to construct full charts.
Is something wrong or out of date?
Tell us and an editor will check it.
Own this website?
Claim this listing
Claim the listing and suggest updates yourself. An editor checks every claim first.