
NYC Taxi Visualization Blog
A Day in the Life is an interactive visualization exploring New York City taxi activity.
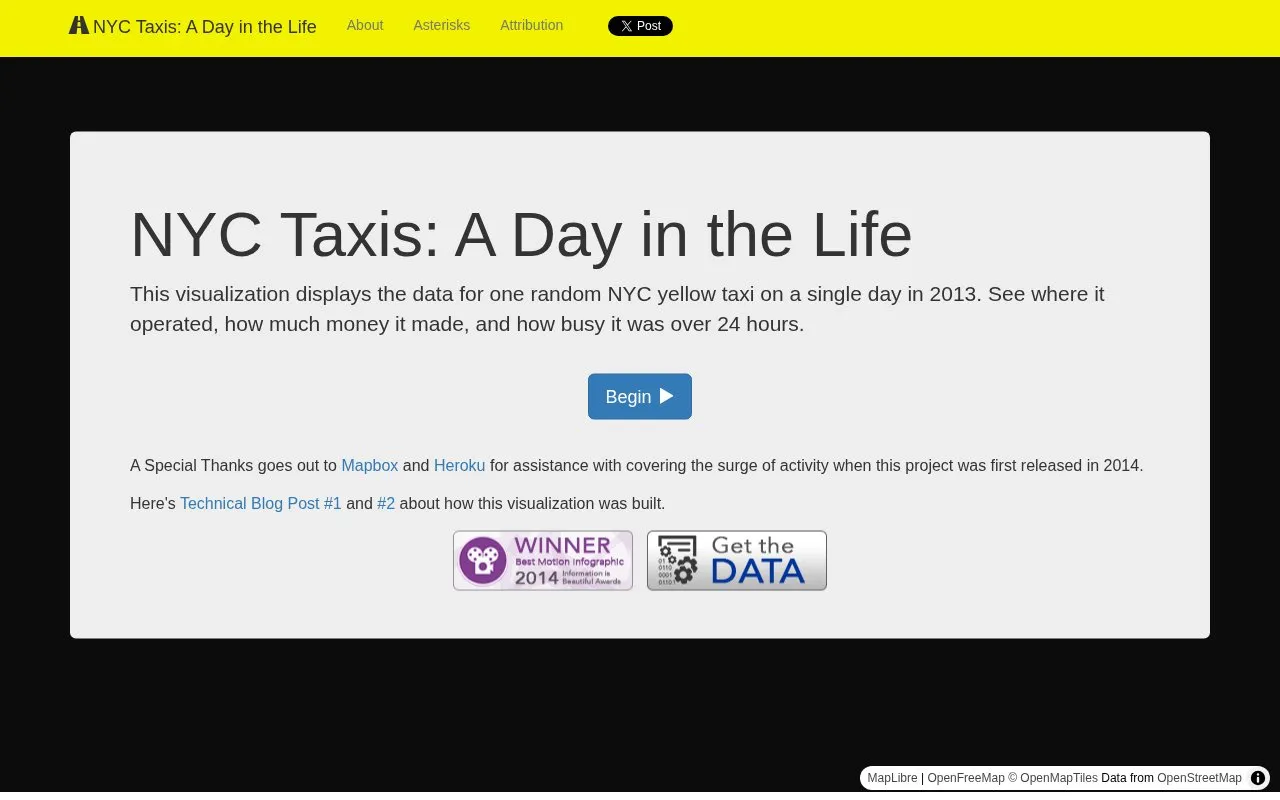
About NYC Taxi Visualization Blog
NYC Taxi Visualization Blog hosts 'A Day in the Life,' an interactive web visualization of 2013 New York City yellow taxi activity. It displays the 24-hour operations of a single randomly selected taxi, including trip routes, earnings, and passenger counts, using data from ~170 million 2013 TLC trip records. Key limitations include that displayed trip and empty taxi routes are estimated via the Google Directions API rather than reflecting the taxi's actual path, and tip totals only include credit card tips, as cash tips are not present in the source data.
Key features
- Displays 24-hour activity of a single 2013 NYC yellow taxi
- Shows trip routes, start/end points, and estimated empty taxi movement
- Tracks running totals of fares, surcharges, taxes, tips, tolls, and passengers
- Allows loading data for a different randomly selected taxi
- Offers adjustable playback speed for the 24-hour timeline
Best for: Civic tech enthusiasts, data visualization learners, and people interested in NYC taxi operations.
Good for
- Uses publicly released 2013 NYC taxi trip data from the TLC
- Provides an interactive, animated view of daily taxi activity
- Includes technical blog posts explaining the visualization's build process
Watch out for
- Trip routes are estimated via Google Directions API, not actual taxi paths
- Empty taxi movement between trips is an estimated route, not recorded travel
- Tip totals only include credit card tips, excluding cash tips
NYC Taxi Visualization Blog at a glance
- Website
- chriswhong.github.io/nyctaxi
- Category
- Design & Creative › Charts & Data Visualization
- Type
- Online tool
- Pricing
- Not confirmed. Check the site
- Platforms
- Web
- Open source
- Not stated
- Last checked
- Oct 6, 2026 · Online when checked
- Listed
- Oct 5, 2026
Guides for Charts & Data Visualization
NYC Taxi Visualization Blog alternatives
Tools and sites you could use instead, ranked by how closely they match.

Free open-source software for network visualization and analysis, with a desktop app and browser-based Gephi Lite for exploring graphs.
FreeOpen source
24 alternatives
UMLet provides free, open source UML drawing with a simple interface for making diagrams, including sequence and activity diagrams.
PlantText provides an online editor for PlantUML code and generates class, sequence, activity, and state diagrams.

Datawrapper creates interactive charts, maps, and tables in a web app without requiring code, according to its site.
Pick
24 alternatives
Interactive charts for multidimensional datasets can be built with dc.js, a JavaScript library that supports Crossfilter.

Flourish creates charts, maps, and interactive content for data storytelling without requiring coding.
Popular in Charts & Data Visualization
Well-known listings from the same topic.
Data GIF Makerdatagifmaker.withgoogle.comDataVizCataloguedatavizcatalogue.comLineGraphMakerlinegraphmaker.coaltairaltair-viz.github.ioCharts Buildercharts.hohli.comPie Chart Makerpiechartmaker.co


NYC Taxi Visualization Blog FAQ
What year is the taxi data from?
The visualization uses 2013 NYC yellow taxi trip data.
Why are the displayed trip routes not exact?
Routes are generated by passing start and end locations to the Google Directions API, so they represent possible, not actual, taxi paths.
Are cash tips included in the tip totals?
No, only tips from credit card transactions are included, as cash tips are not in the source data.
Is something wrong or out of date?
Tell us and an editor will check it.
Own this website?
Claim this listing
Claim the listing and suggest updates yourself. An editor checks every claim first.