
Editor
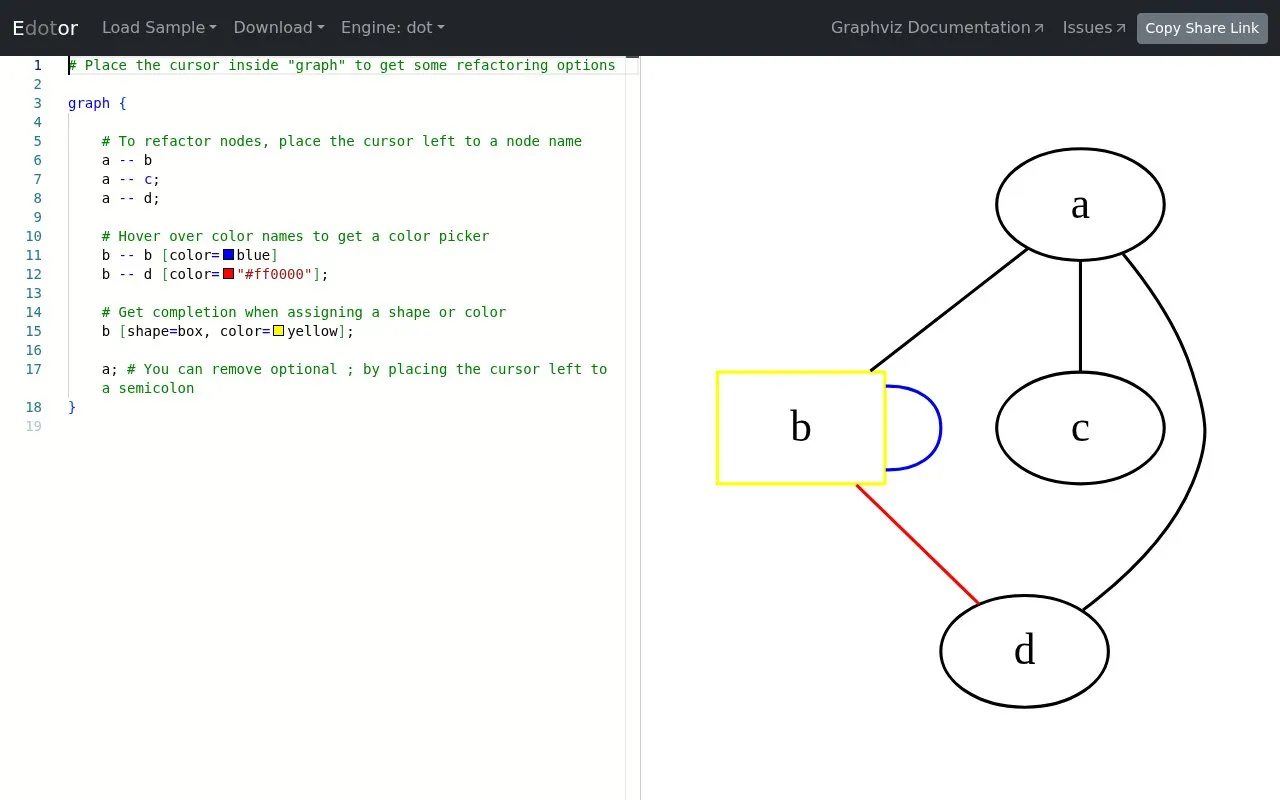
Edotor provides a web-based editor for creating and editing Graphviz diagrams.
About Editor
Edotor is a web-based online editor designed for creating and editing Graphviz diagrams. It operates entirely in a web browser, so users do not need to install local software or tools to access or use the tool.
The editor supports building new Graphviz diagrams from scratch as well as modifying existing Graphviz projects. It is intended for users who regularly work with Graphviz for technical diagramming tasks. It suits developers, technical writers, data visualization specialists, and anyone who needs to generate Graphviz diagrams without setting up local editing environments.
Key features
- Fully web-based, no local software installation required
- Supports creating new Graphviz diagrams from scratch
- Supports editing existing Graphviz diagrams
- Built specifically for Graphviz diagram workflows
Best for: It is most beneficial for users who need to create or edit Graphviz diagrams without installing local software, including developers, technical writers, and data visualization professionals.
Good for
- No local installation needed, accessible from any device with a browser
- Purpose-built for Graphviz diagram creation and editing
- Eliminates the need to set up local Graphviz editing tools
Editor at a glance
- Website
- edotor.net
- Category
- Design & Creative › Charts & Data Visualization
- Type
- Online tool
- Pricing
- Not confirmed. Check the site
- Platforms
- Web
- Open source
- Not stated
- Last checked
- Oct 5, 2026 · Online when checked
- Listed
- Oct 5, 2026
Guides for Charts & Data Visualization
Editor alternatives
Tools and sites you could use instead, ranked by how closely they match.

Kroki provides one API for generating diagrams from textual descriptions using libraries such as Mermaid, PlantUML, Graphviz, and D2.

Graphviz creates diagrams from graph descriptions and provides open-source software for visualizing structural information.

draw.io provides a free, open source application for creating diagrams, with storage options chosen by each team.
pygal provides Python tools for creating charts and visualizing data in applications.

RAWGraphs is a free, open-source tool for creating data visualizations.

Matplotlib provides Python tools for creating plots and visualizations from data.
Popular in Charts & Data Visualization
Well-known listings from the same topic.
Data GIF Makerdatagifmaker.withgoogle.comDatawrapperdatawrapper.deDataVizCataloguedatavizcatalogue.comLineGraphMakerlinegraphmaker.coaltairaltair-viz.github.ioCharts Buildercharts.hohli.com


Editor FAQ
What is Edotor used for?
Edotor is a web-based tool for creating and editing Graphviz diagrams, with no local software required.
Do I need to install software to use Edotor?
No, Edotor runs entirely in your web browser with no additional installations needed.
What types of diagrams can I create with Edotor?
Edotor supports creating and editing standard Graphviz diagrams using the DOT language.
Is Edotor free to use?
Pricing information for Edotor is not listed on its official homepage, so cost details are currently unavailable.
Is something wrong or out of date?
Tell us and an editor will check it.
Own this website?
Claim this listing
Claim the listing and suggest updates yourself. An editor checks every claim first.